
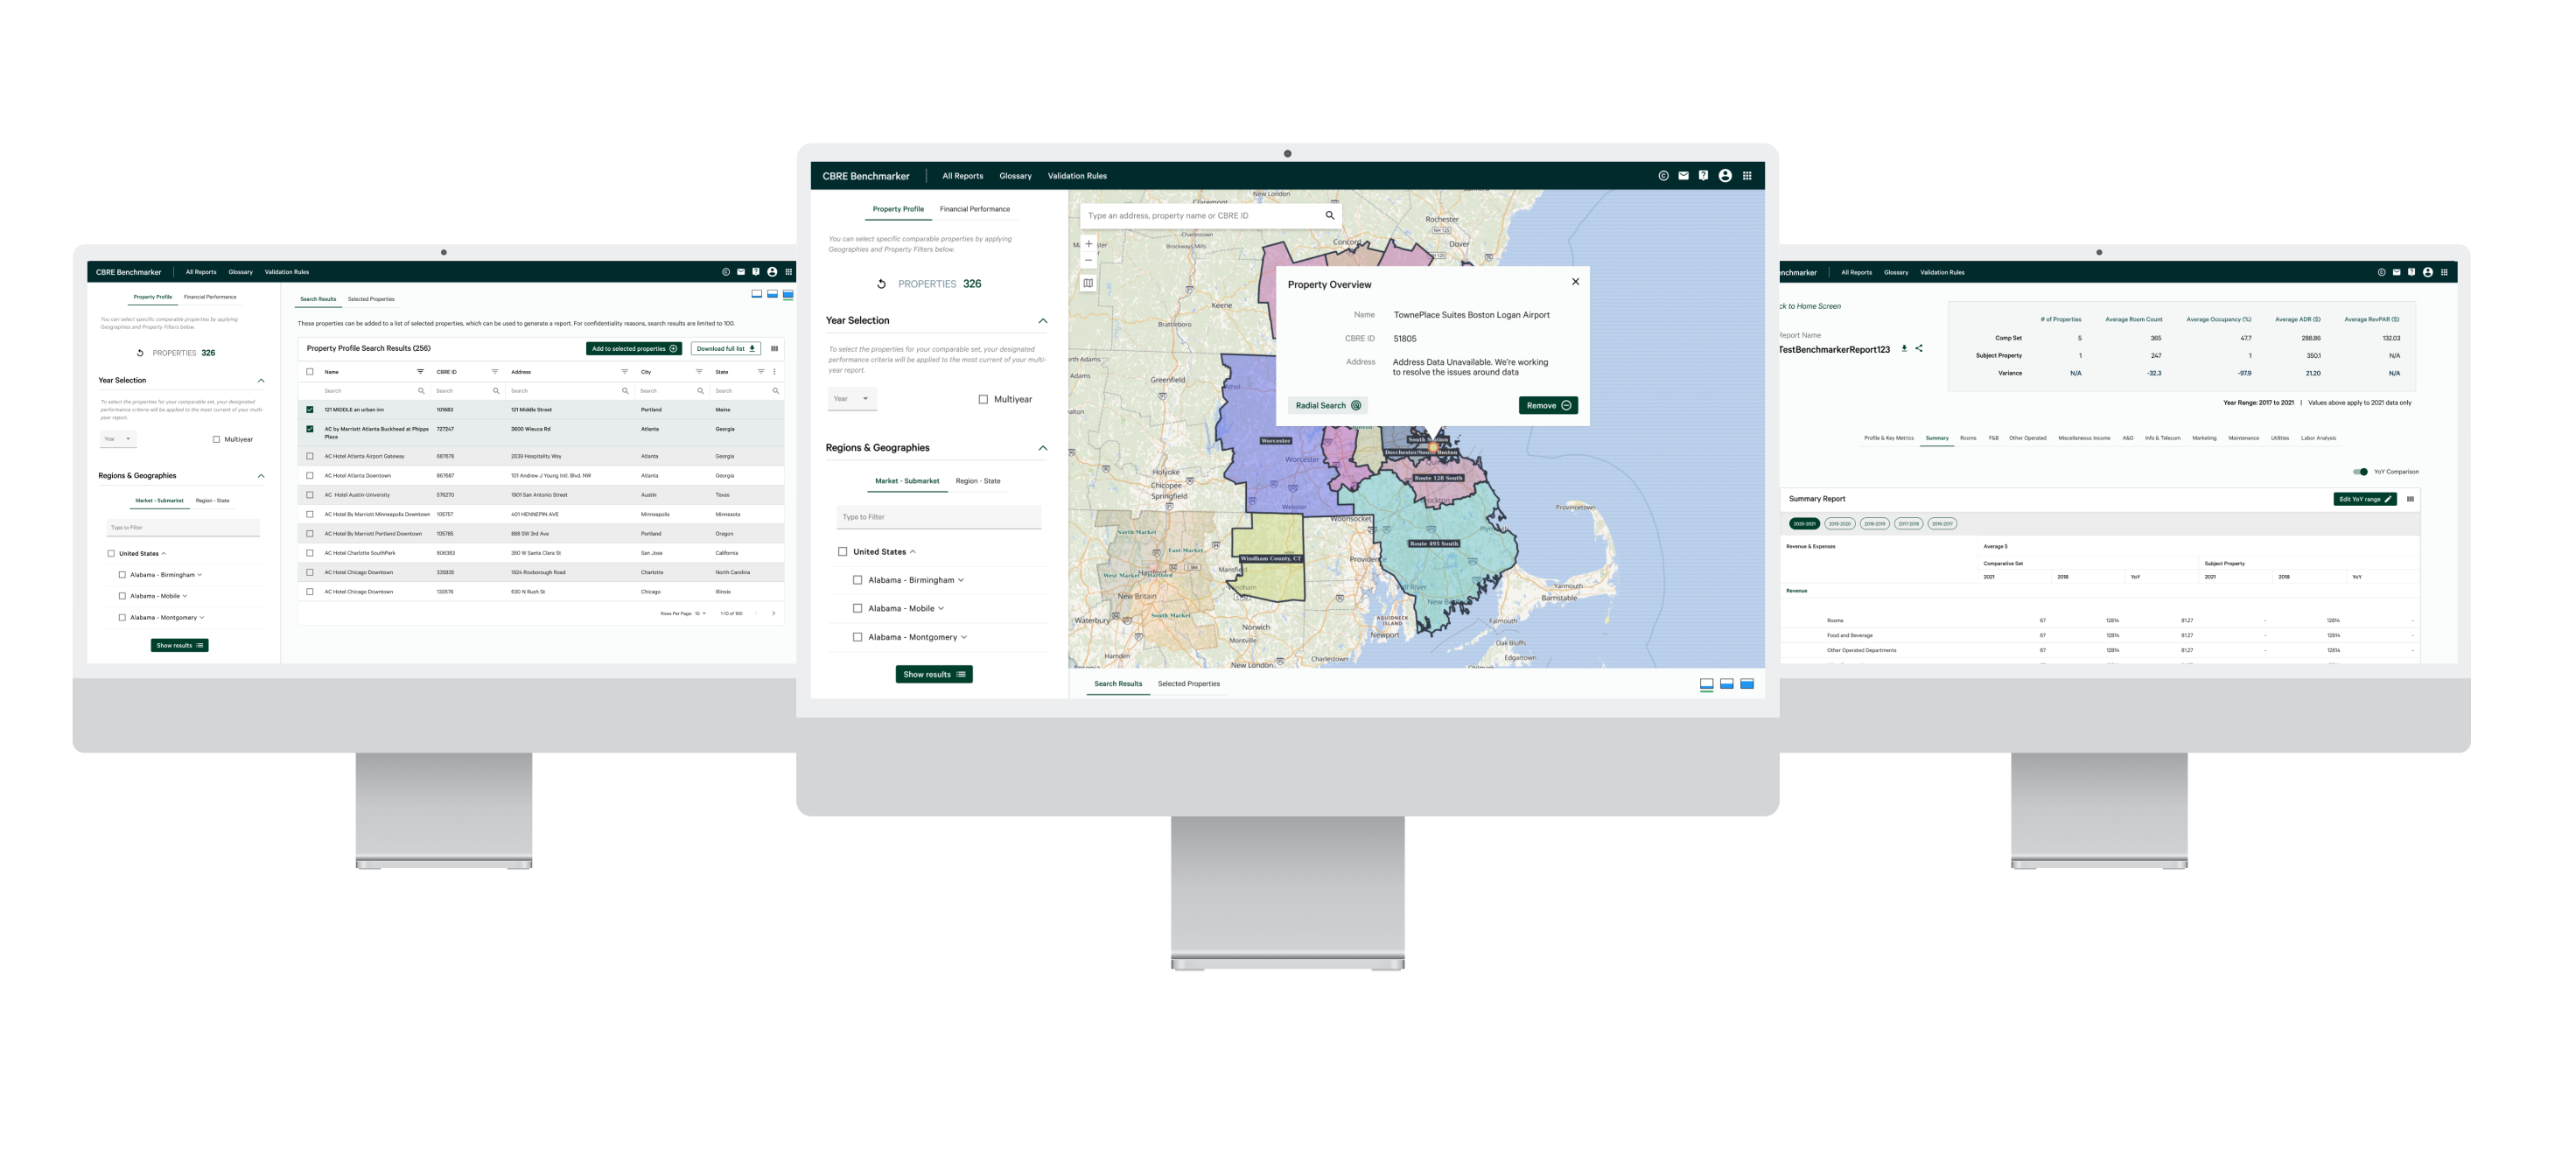
Benchmarker℠ is a product offered by CBRE that allows clients to analyze the aggregated financial performance of a group of hotels. The hotels are selected based on customized criteria set by customers through a range of filters. After filters have been selected, users can then select specific properties to generate reports.
Benchmarker℠ users can select custom criteria to generate financial reports based on their desired years, geographies, and filters. To select specific properties for the reports, there is the option to do so from the map or list view. Generated reports can be viewed and shared directly across individual users and groups within their organization.
As a commercial real estate investor interested in hotel properties, I want to compare the financial details of a group of hotels against another set of hotels based on certain criteria, in order to analyze the financial performance of hotels.
Our target users are real estate investors and developers that are aged from 35-65. Our product users are typically also not tech-savvy based on user interviews.
The Benchmarker application originally had an extremely different look and feel. It incorporated an entirely different style guide, with only limited features available to use.
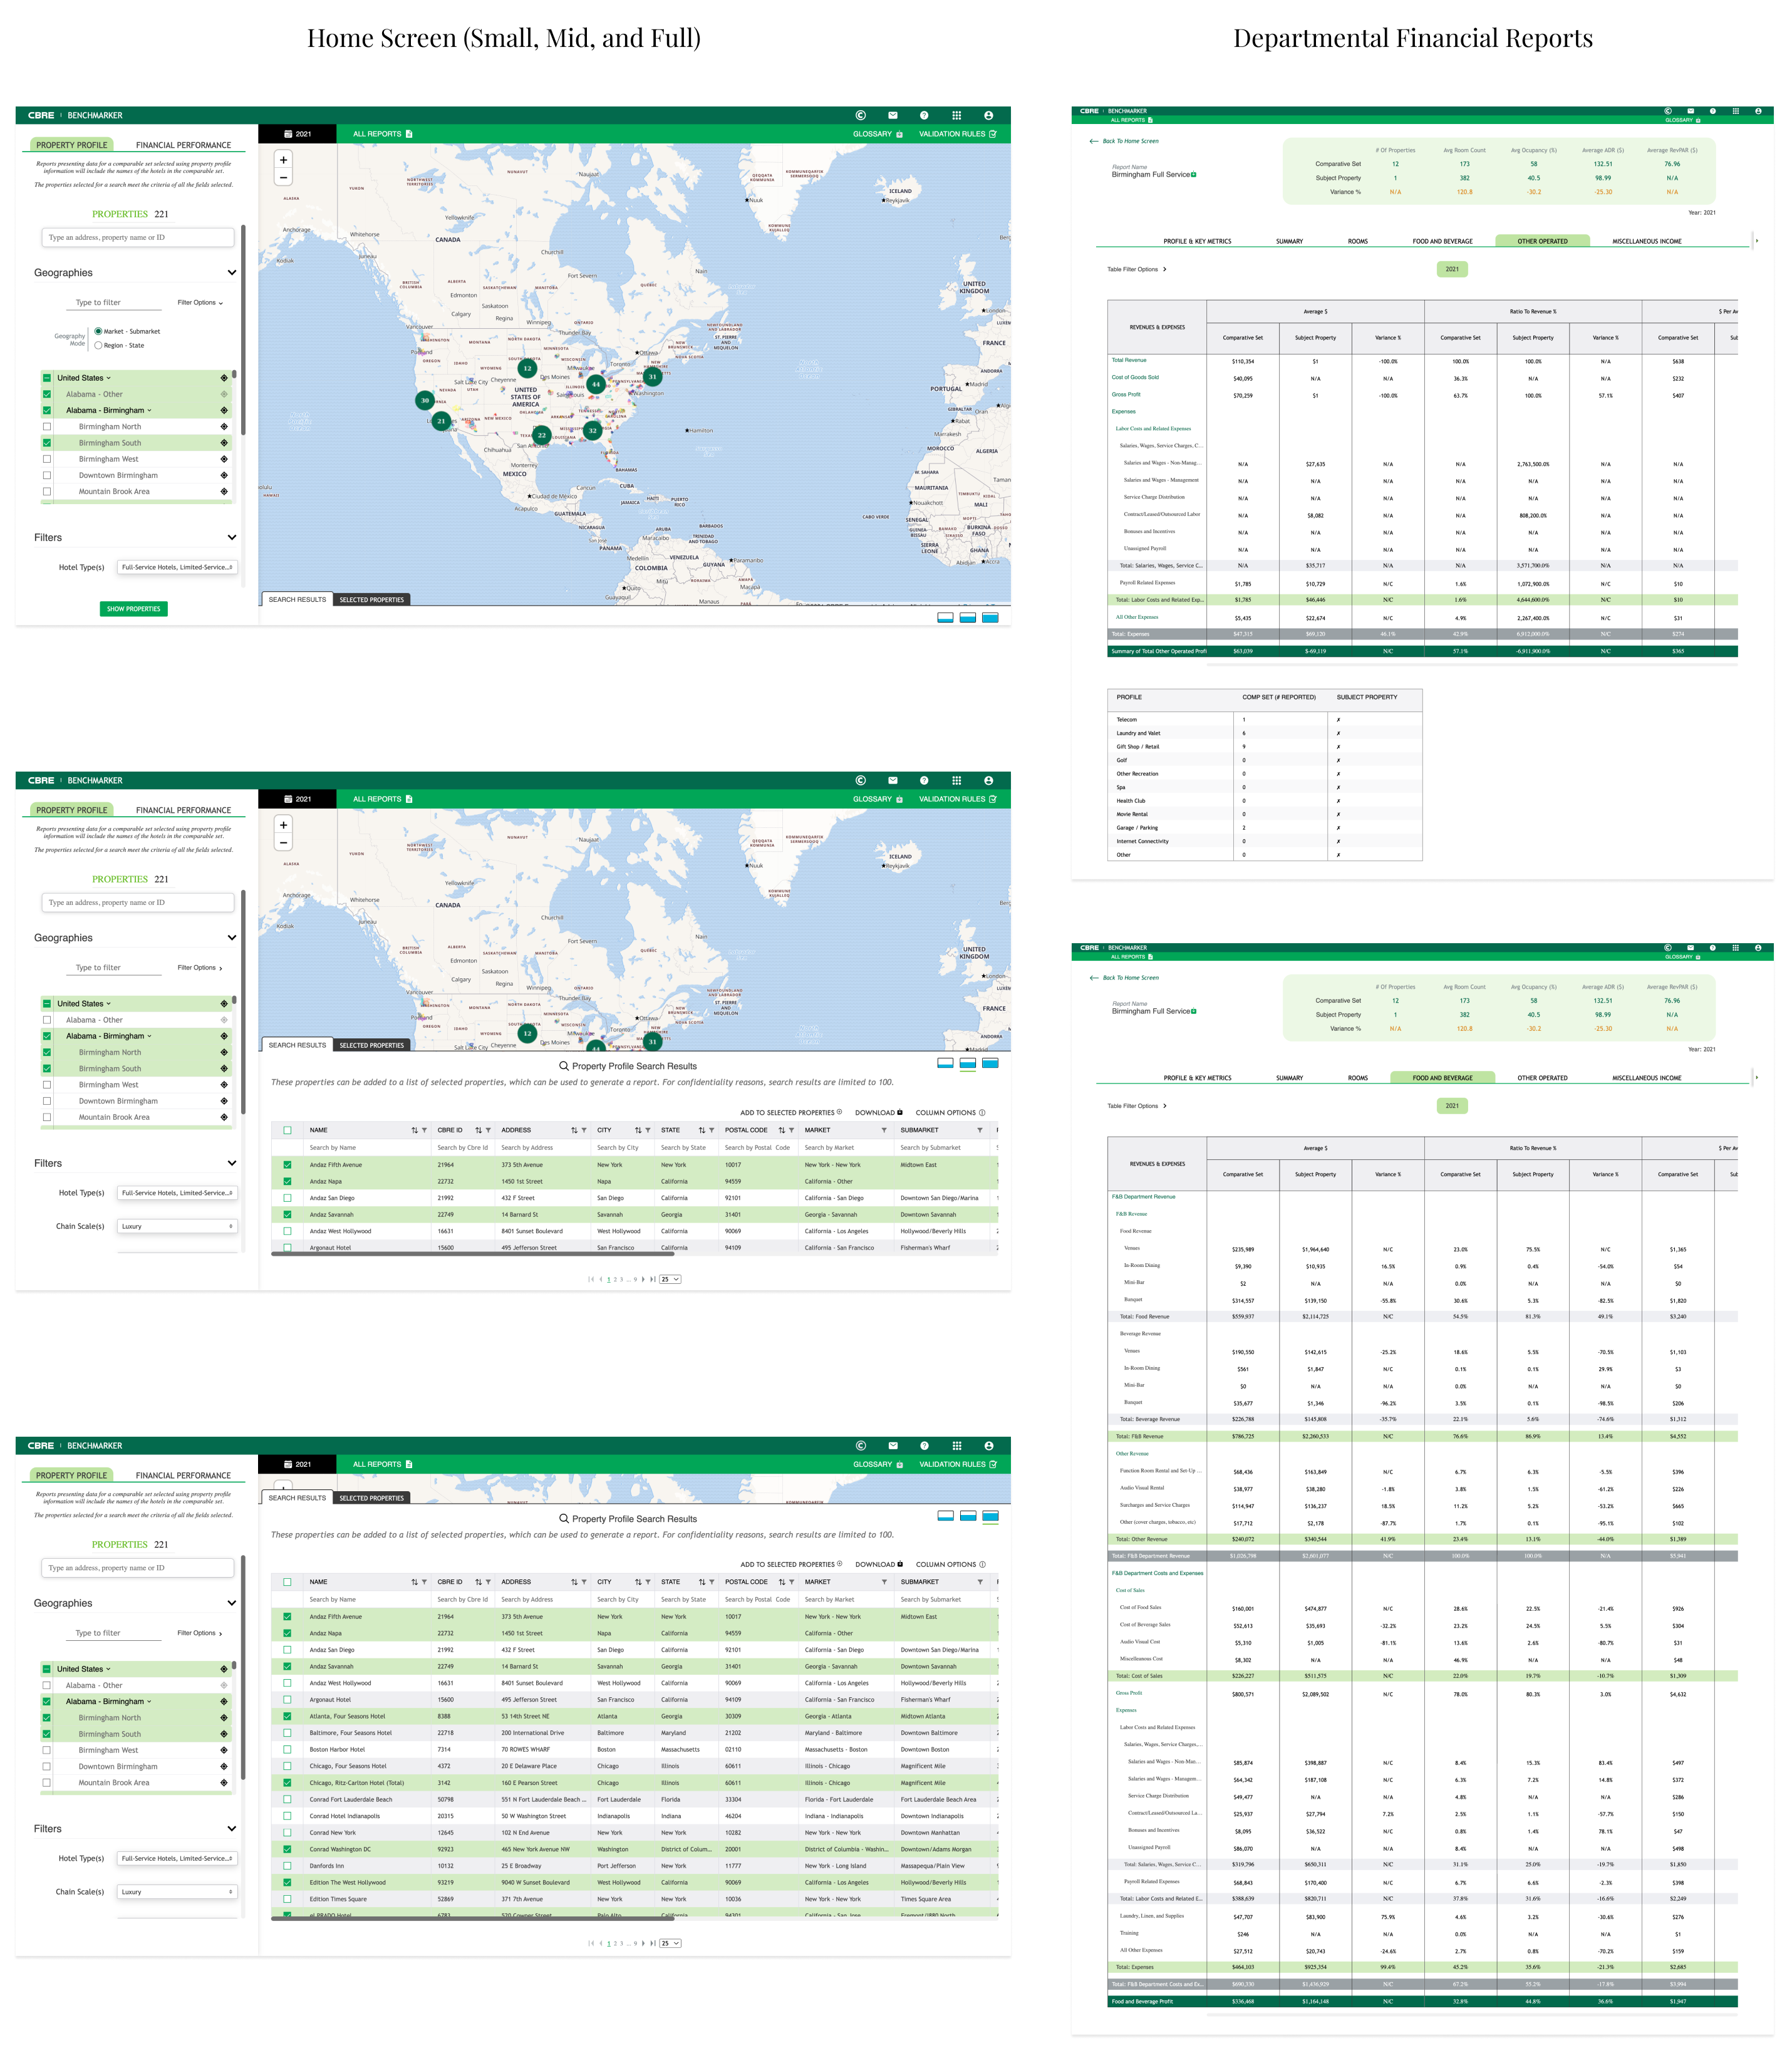
CBRE had a mission to release a reimagined Benchmarker interface with new and enhanced features. To carry this out, I was responsible for implementing our new design system and designing new and existing features. Here's a deeper look into what my contributions were for Benchmarker:
Prior to starting the adoption of our Emerald Design System in the beginning of 2022, CBRE did not have or implement any design system. By creating a design system with centralized components and variants, we were able to cut costs for design and development, as well as maintain an overall brand image through consistency.
While working on this project, I designed with components and variants to speed up the process, while modifying the necessary parts of each component and variant to use for designs. By utilizing components, our designs were able to be delivered much faster than designing each individual component from scratch. In addition, this ensured consistency by reusing standard components and variants for our designs and allowed for design resources to focus more on complex problem solving.
CBRE's full design system, the Emerald Design System, can be viewed with the link below:
To prepare for a fast approaching release, our team of 9 engineers, the product manager, and I would work in sprint cycles to ensure we were aligned on the next most important feature for the product. We followed the agile scrum methodology which consisted of 10-day long sprints by using Azure DevOps.
By the end of each sprint cycle, high-fidelity mockups were intended to be complete to iterate new and existing features, along with QA work and responsive web design implementation. Prototypes were presented to stakeholders at the end of sprints to gain insightful feedback and thoughts before engineer handoff and implementation.
While designing for Benchmarker, there were different use cases for the application depending on several factors. Here are the different use cases I kept in mind to deliver different designs for:
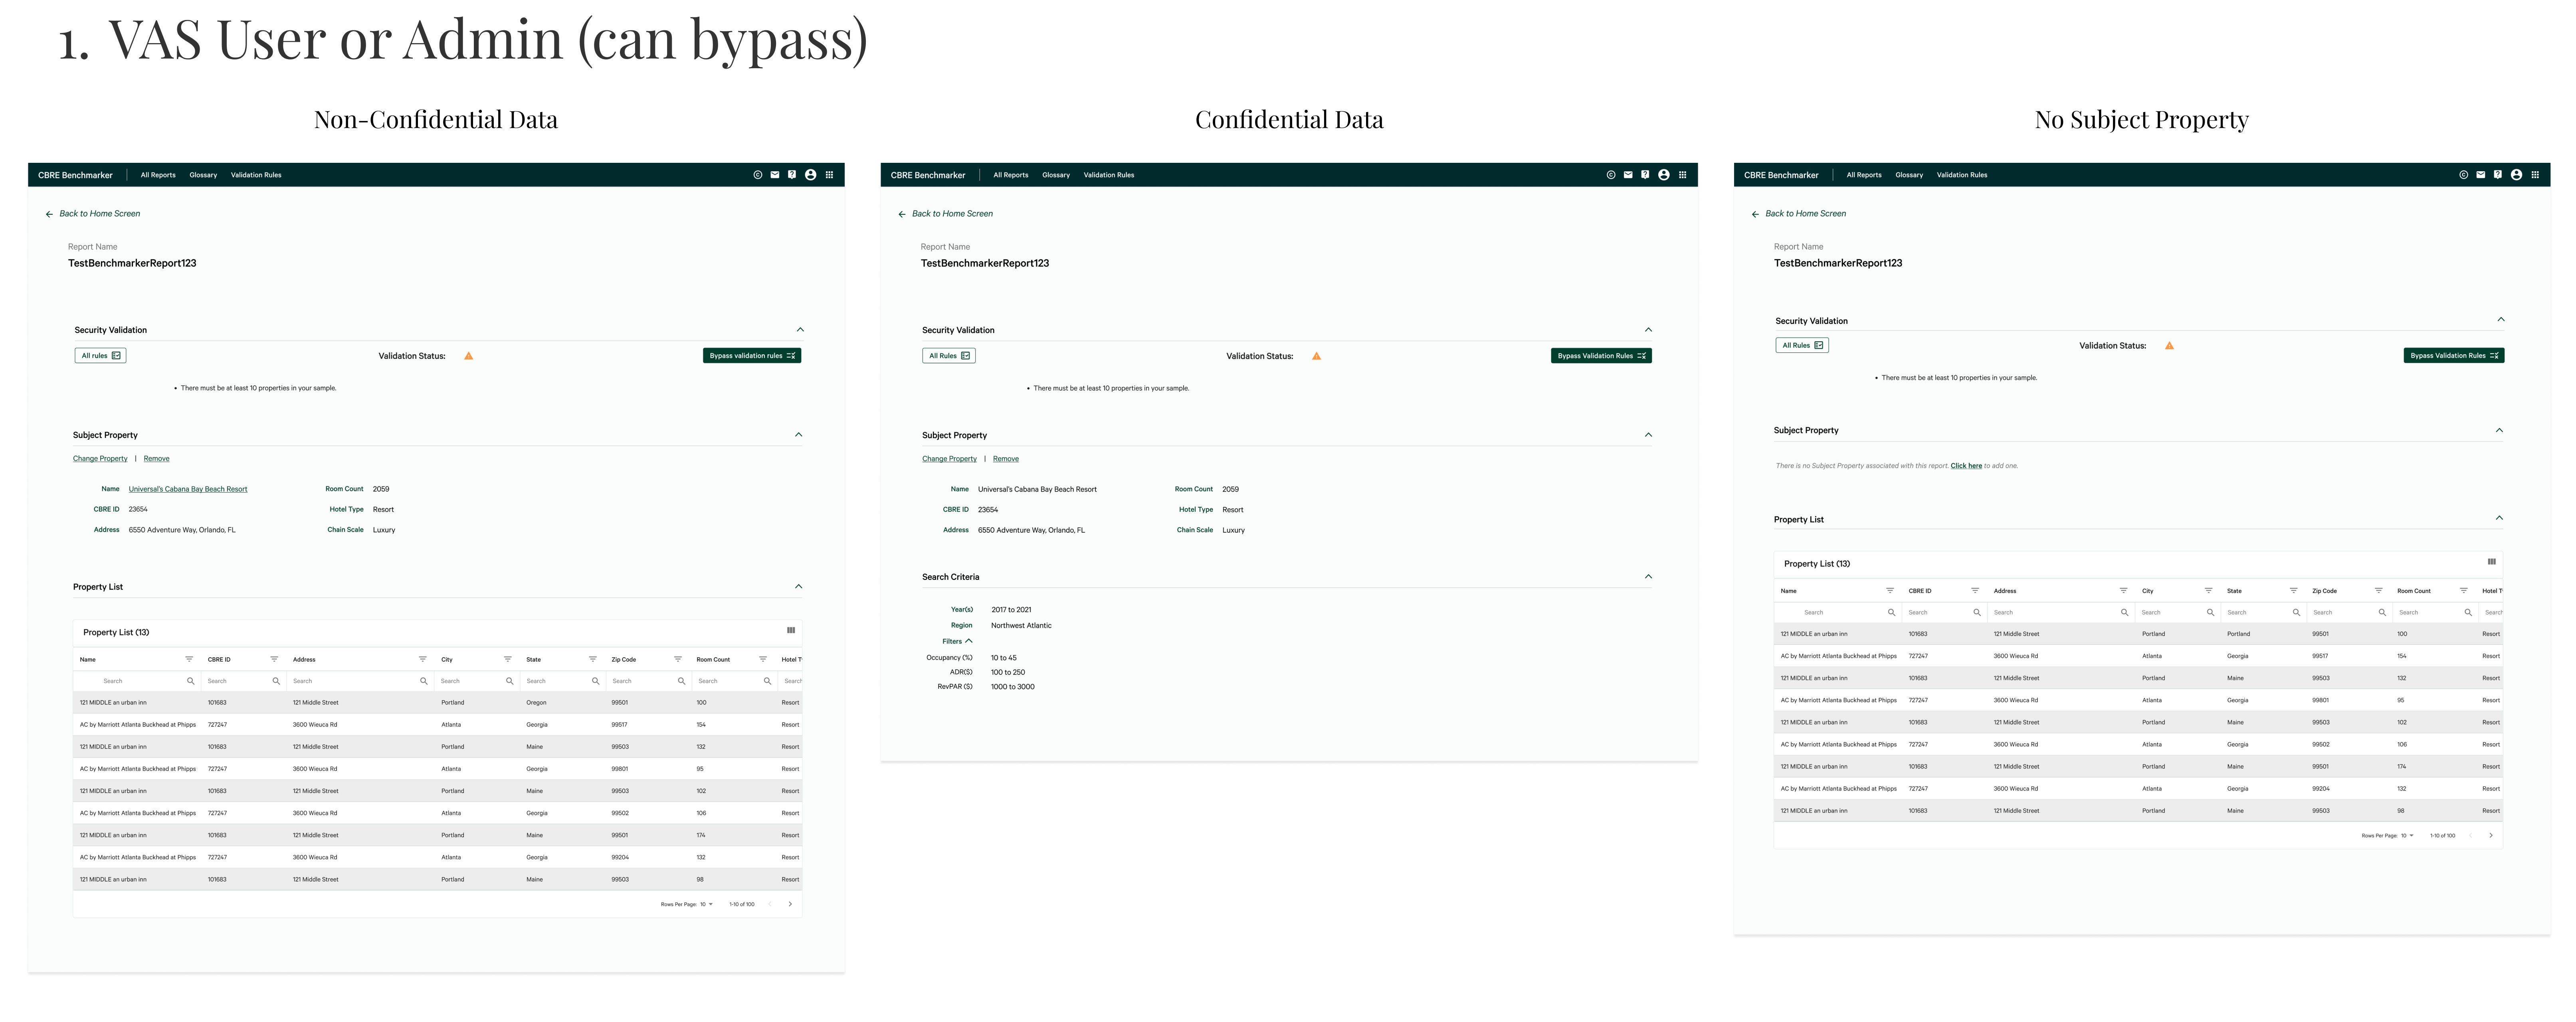
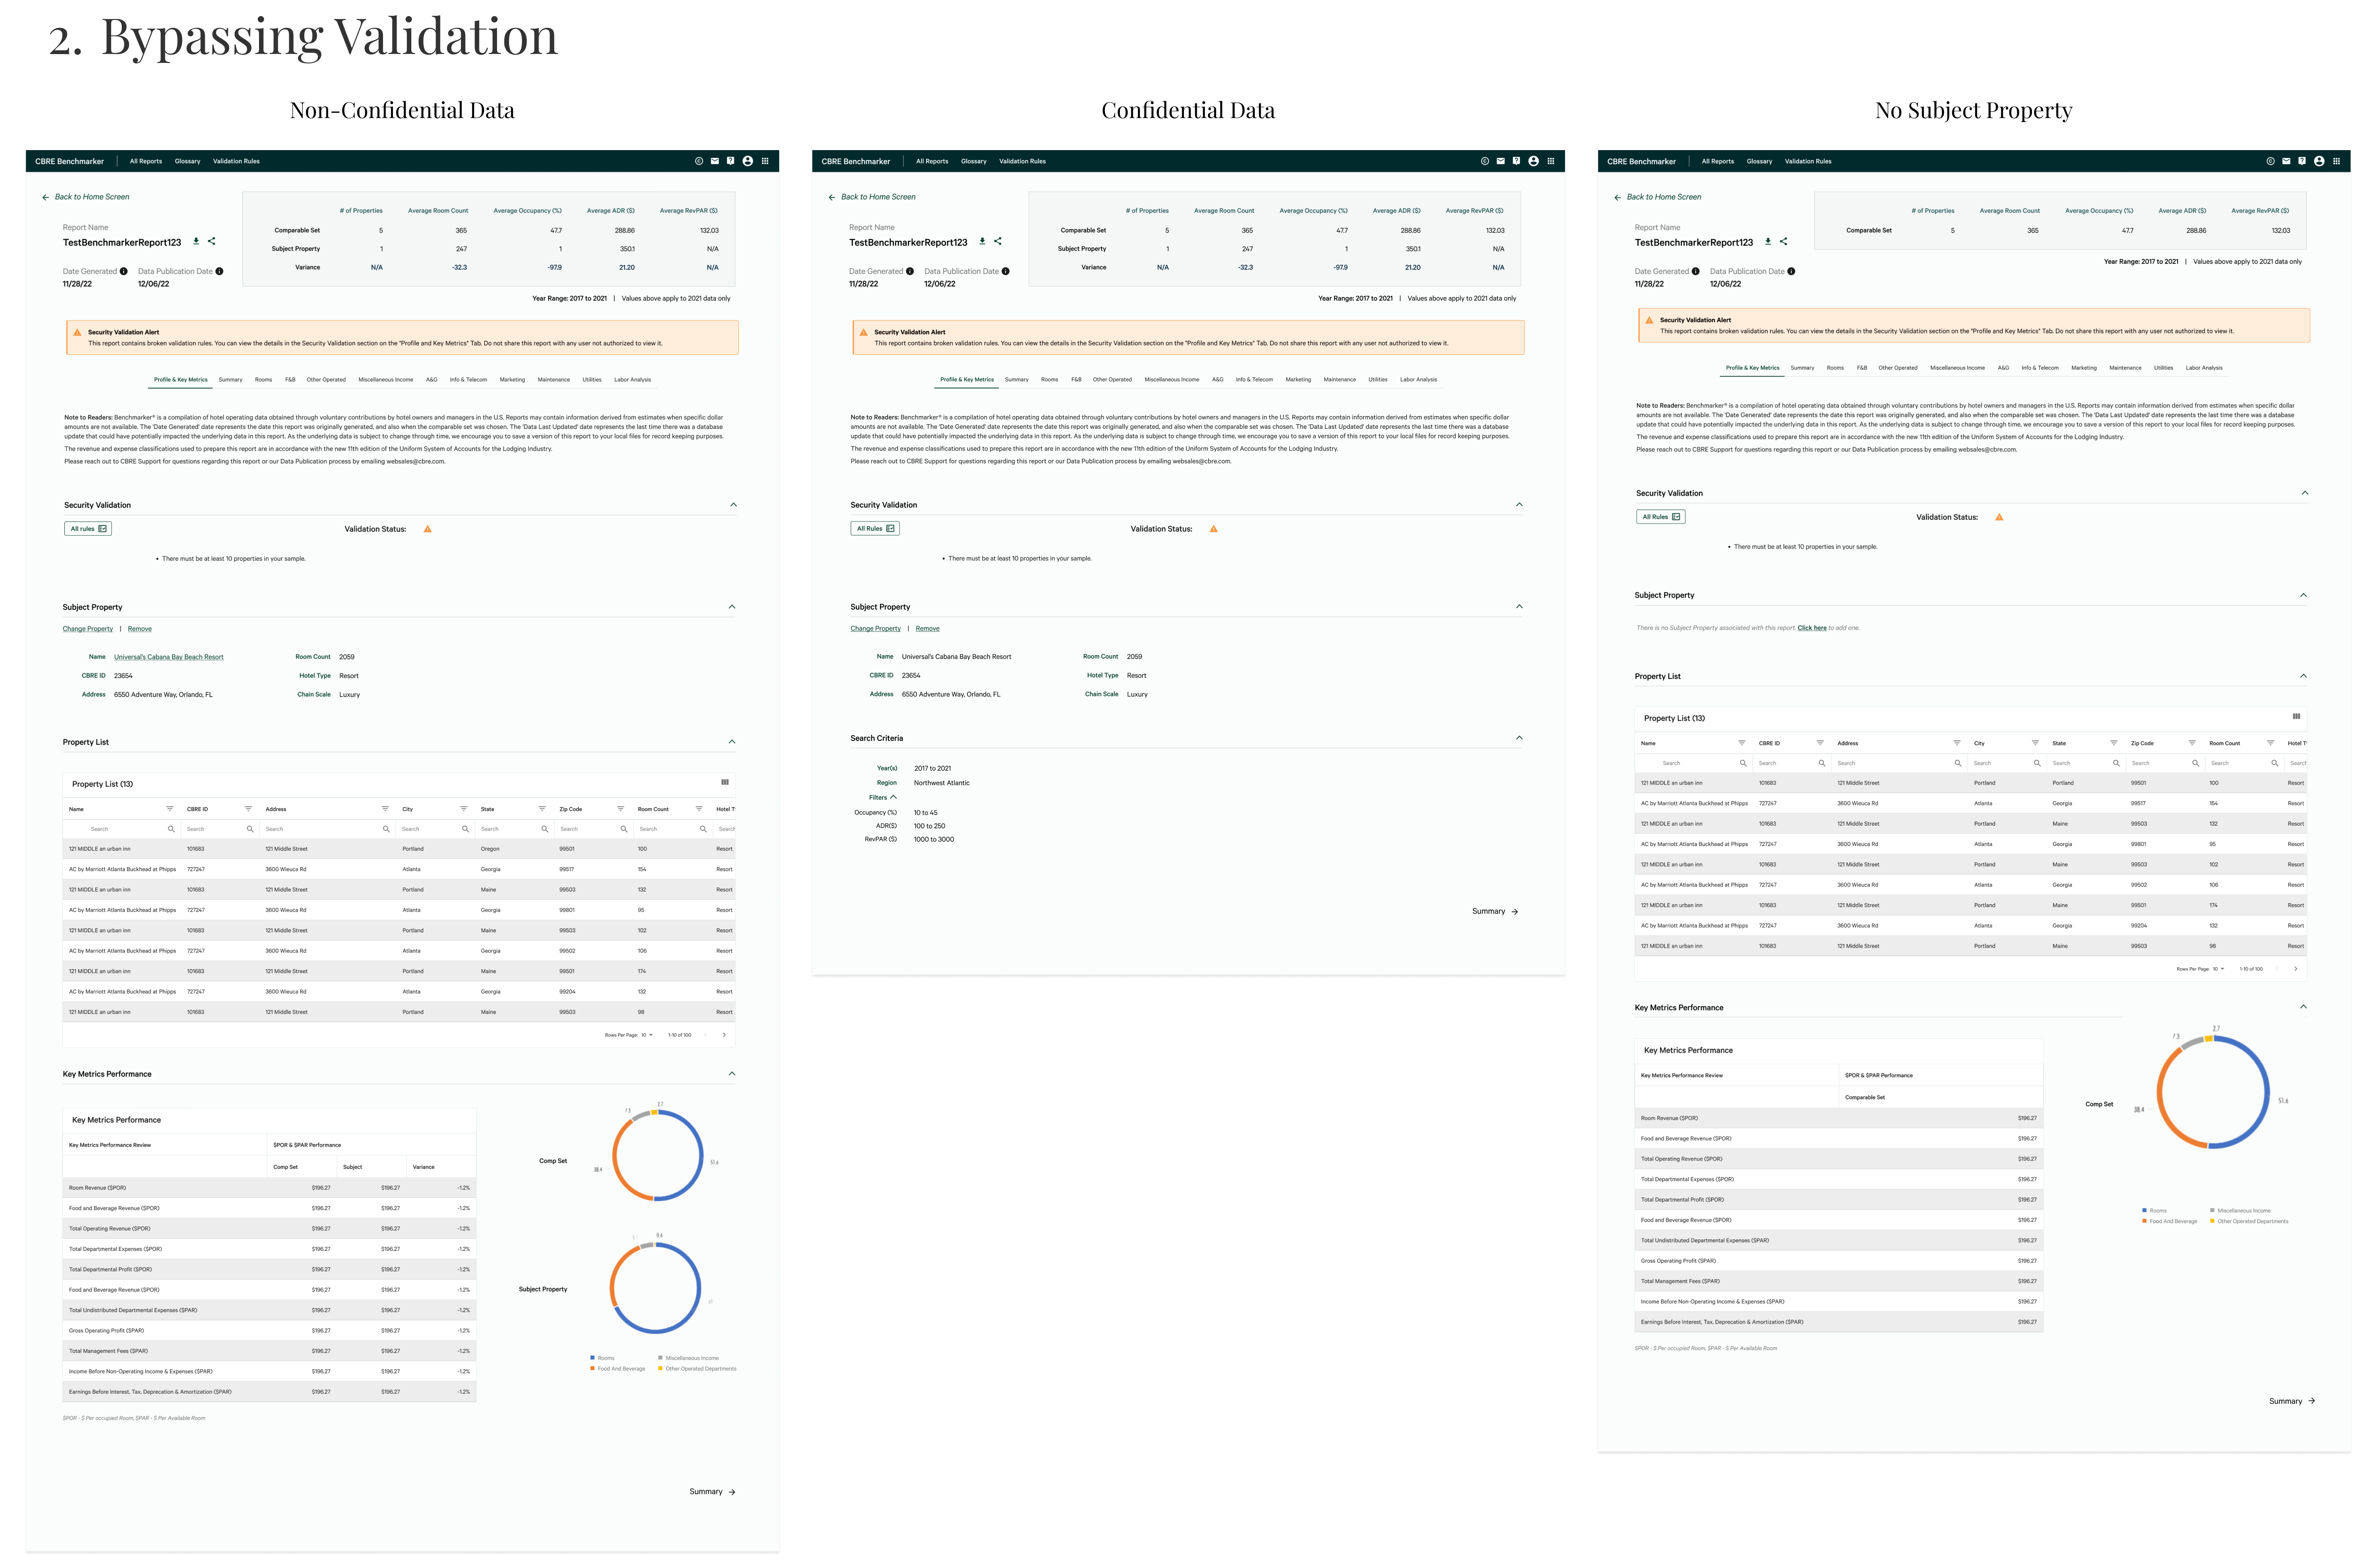
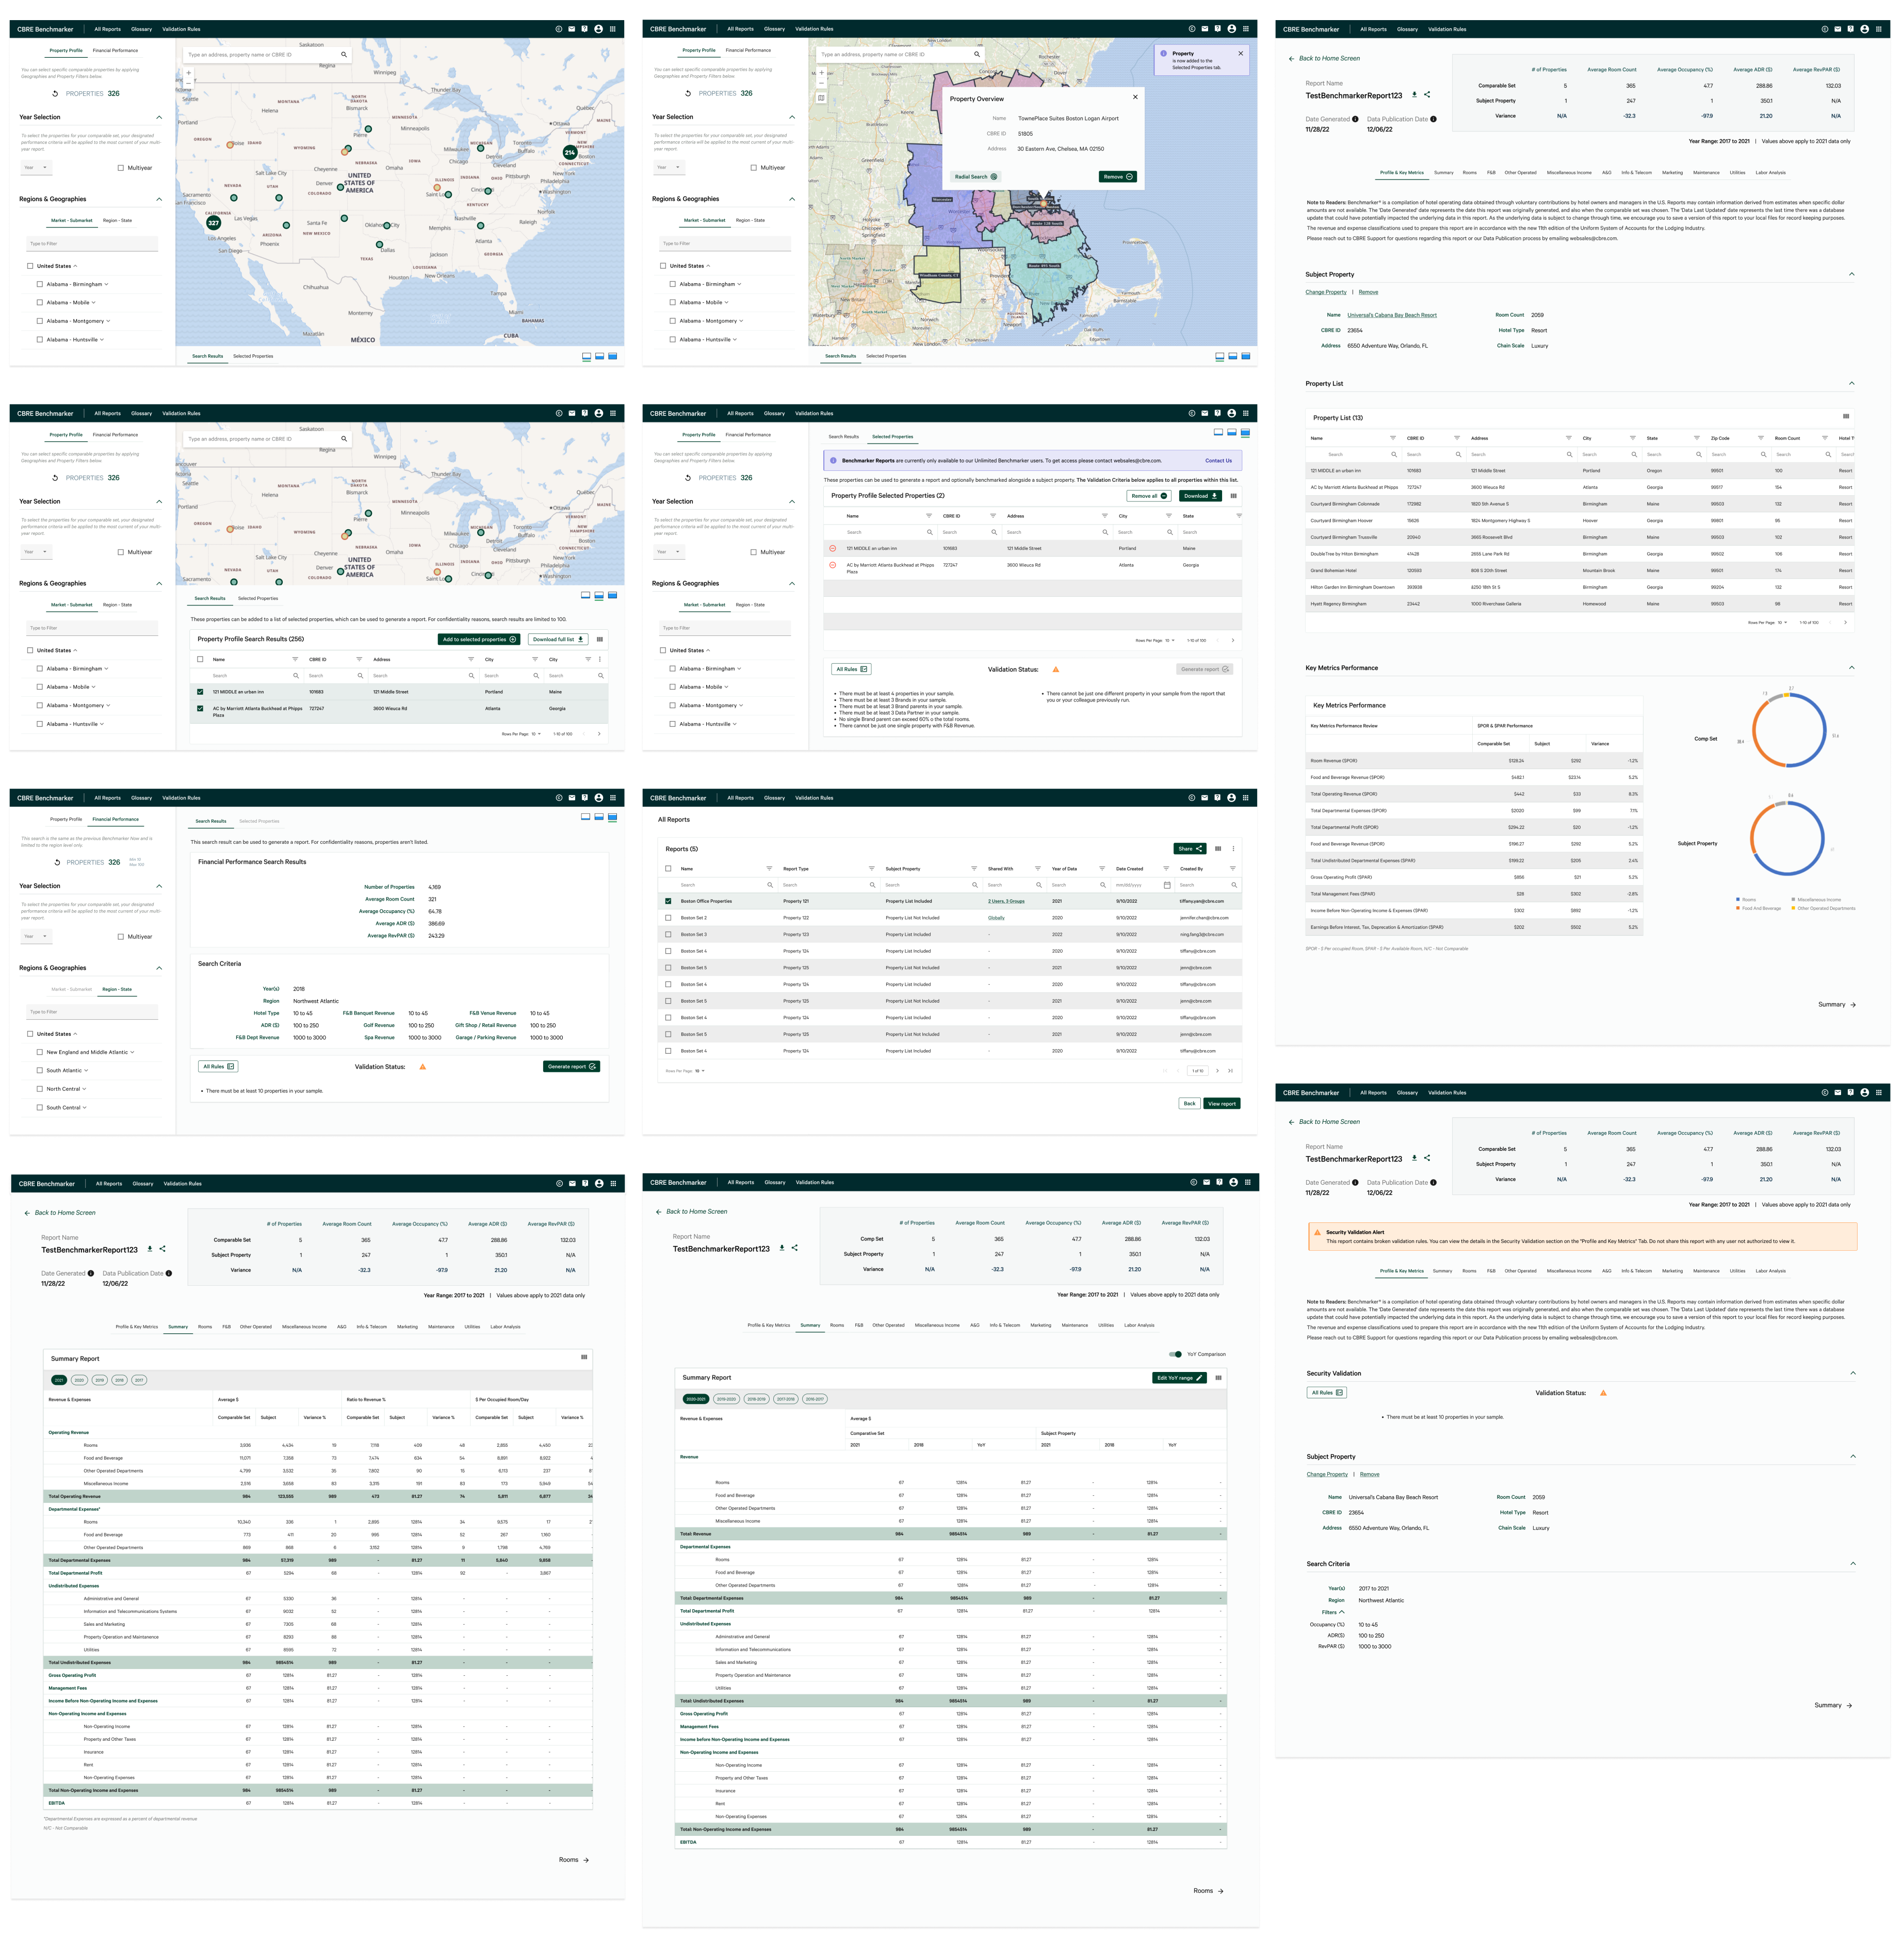
To demonstrate what this app would realistically look and function like, I created high fidelity mockups throughout each sprint.
Because Benchmarker had been previously designed by the time I joined, my designs started as high fidelity mockups. In addition, working in an agile environment meant that I would need to create high fidelity mockups, along with fully functioning prototypes that were ready to present to stakeholders by the end of each sprint.
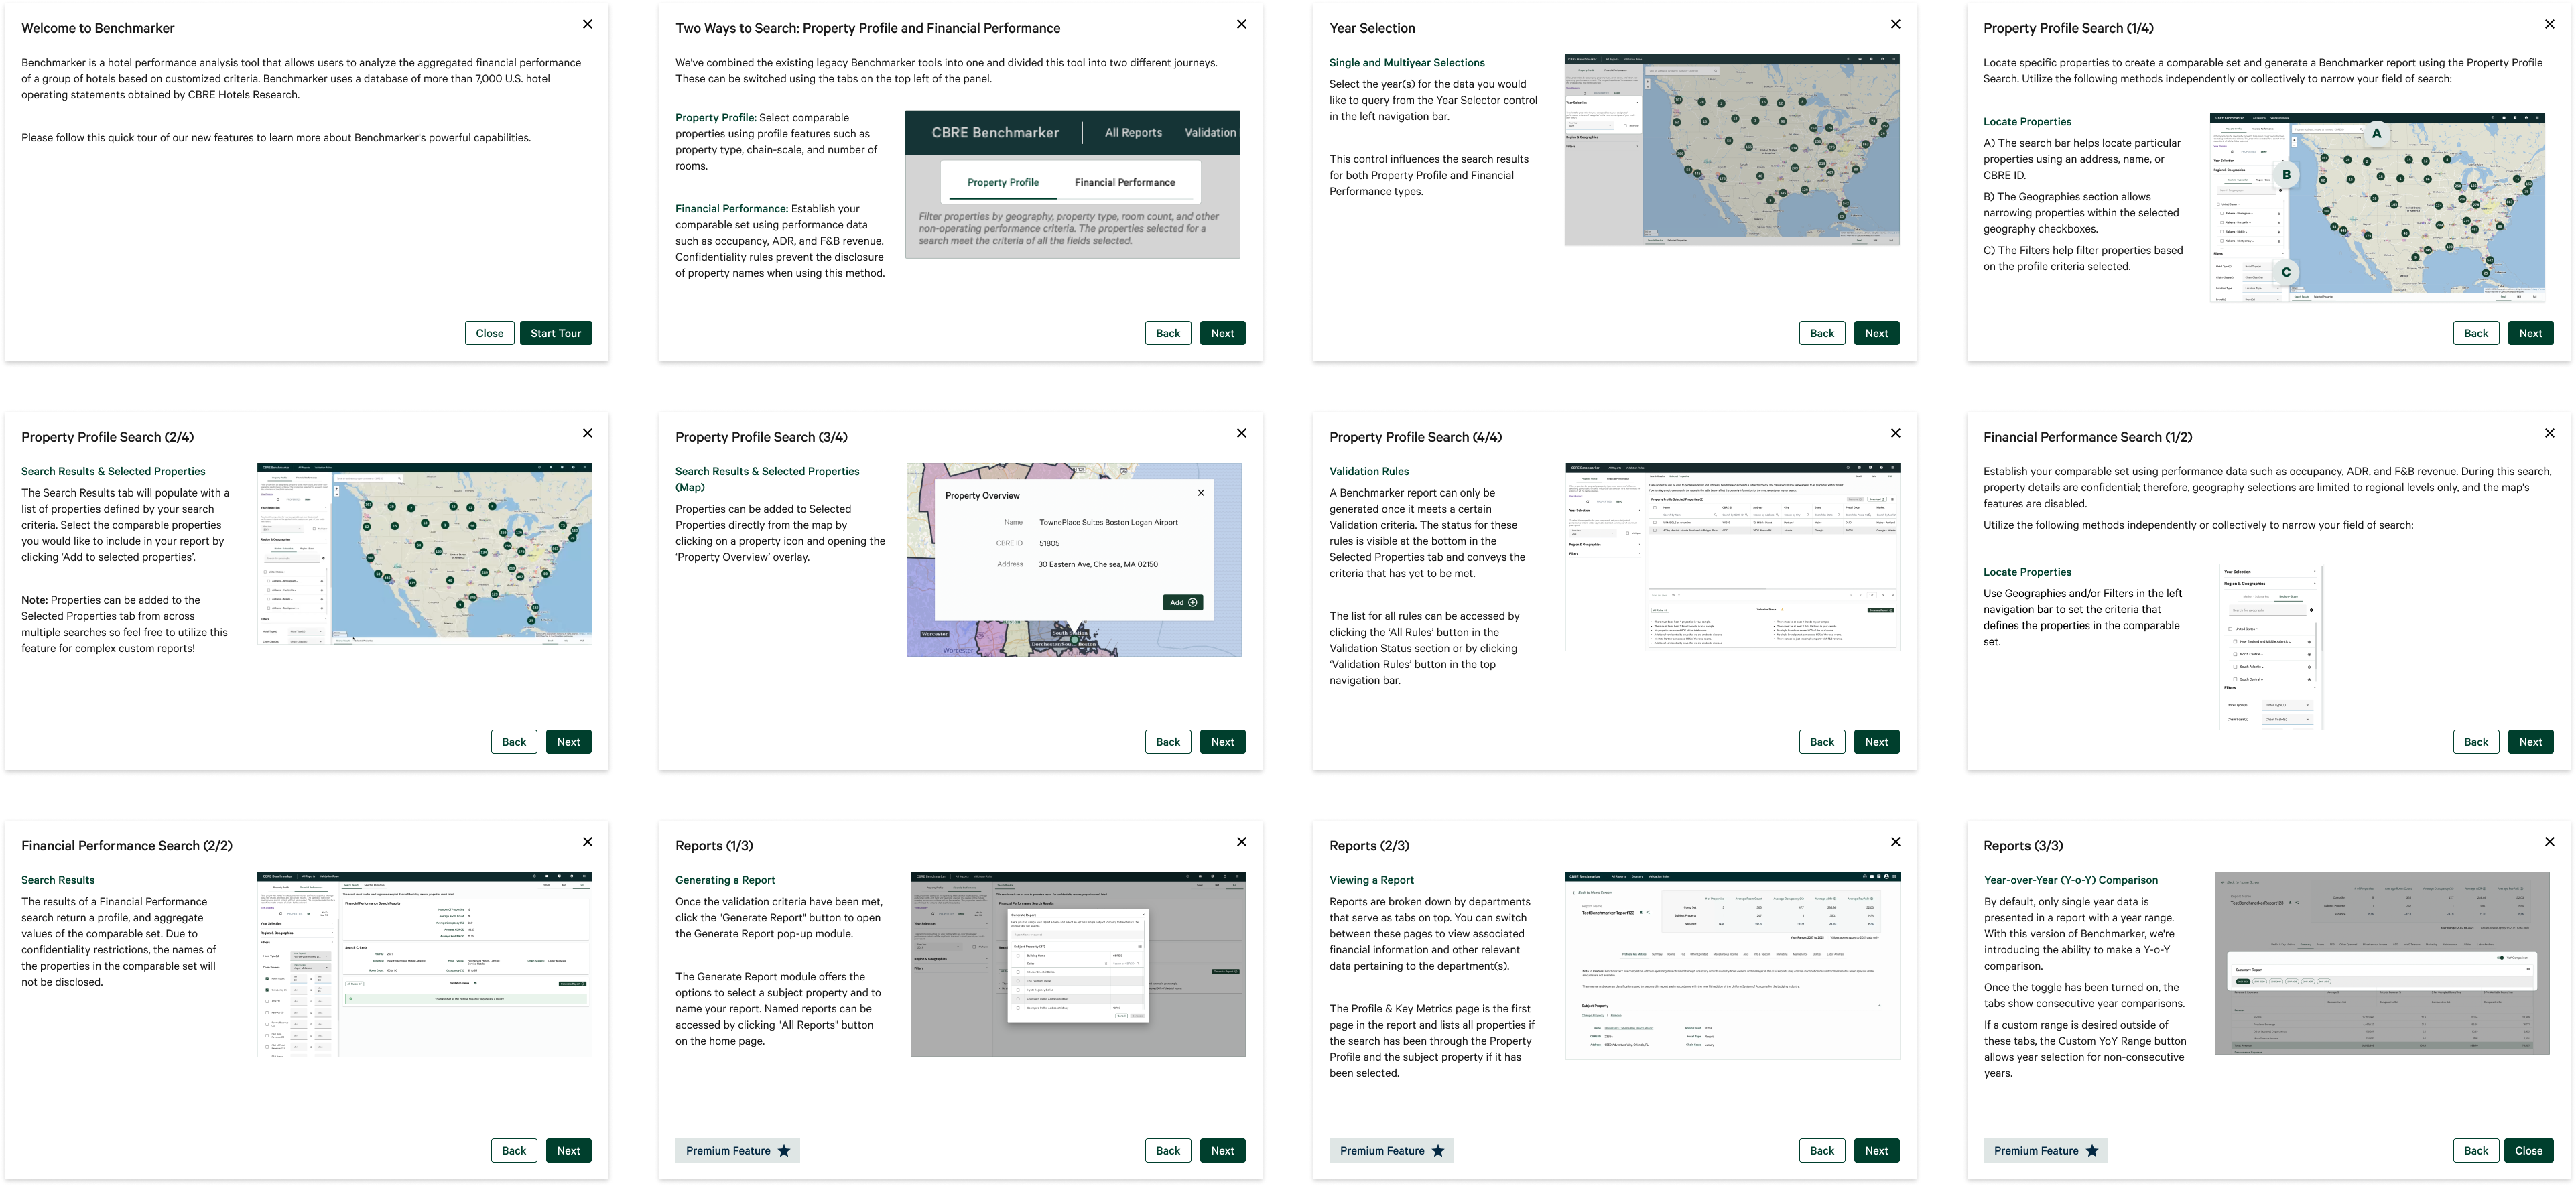
A Welcome Tutorial was designed in order to help users with the interface with clear, concise steps for Benchmarker's key capabilities. This tutorial reflects Nielson Norman’s usability heuristic of “Help and Documentation”, ensuring that there is documentation to help users with the interface for the most important functionalities. This welcome tutorial would be the first modal that appears automatically upon logging into the application, guiding them with steps on how to get the most of the app.
A key functionality to Benchmarker is the ability to search and add properties. There are several ways to search for a property:
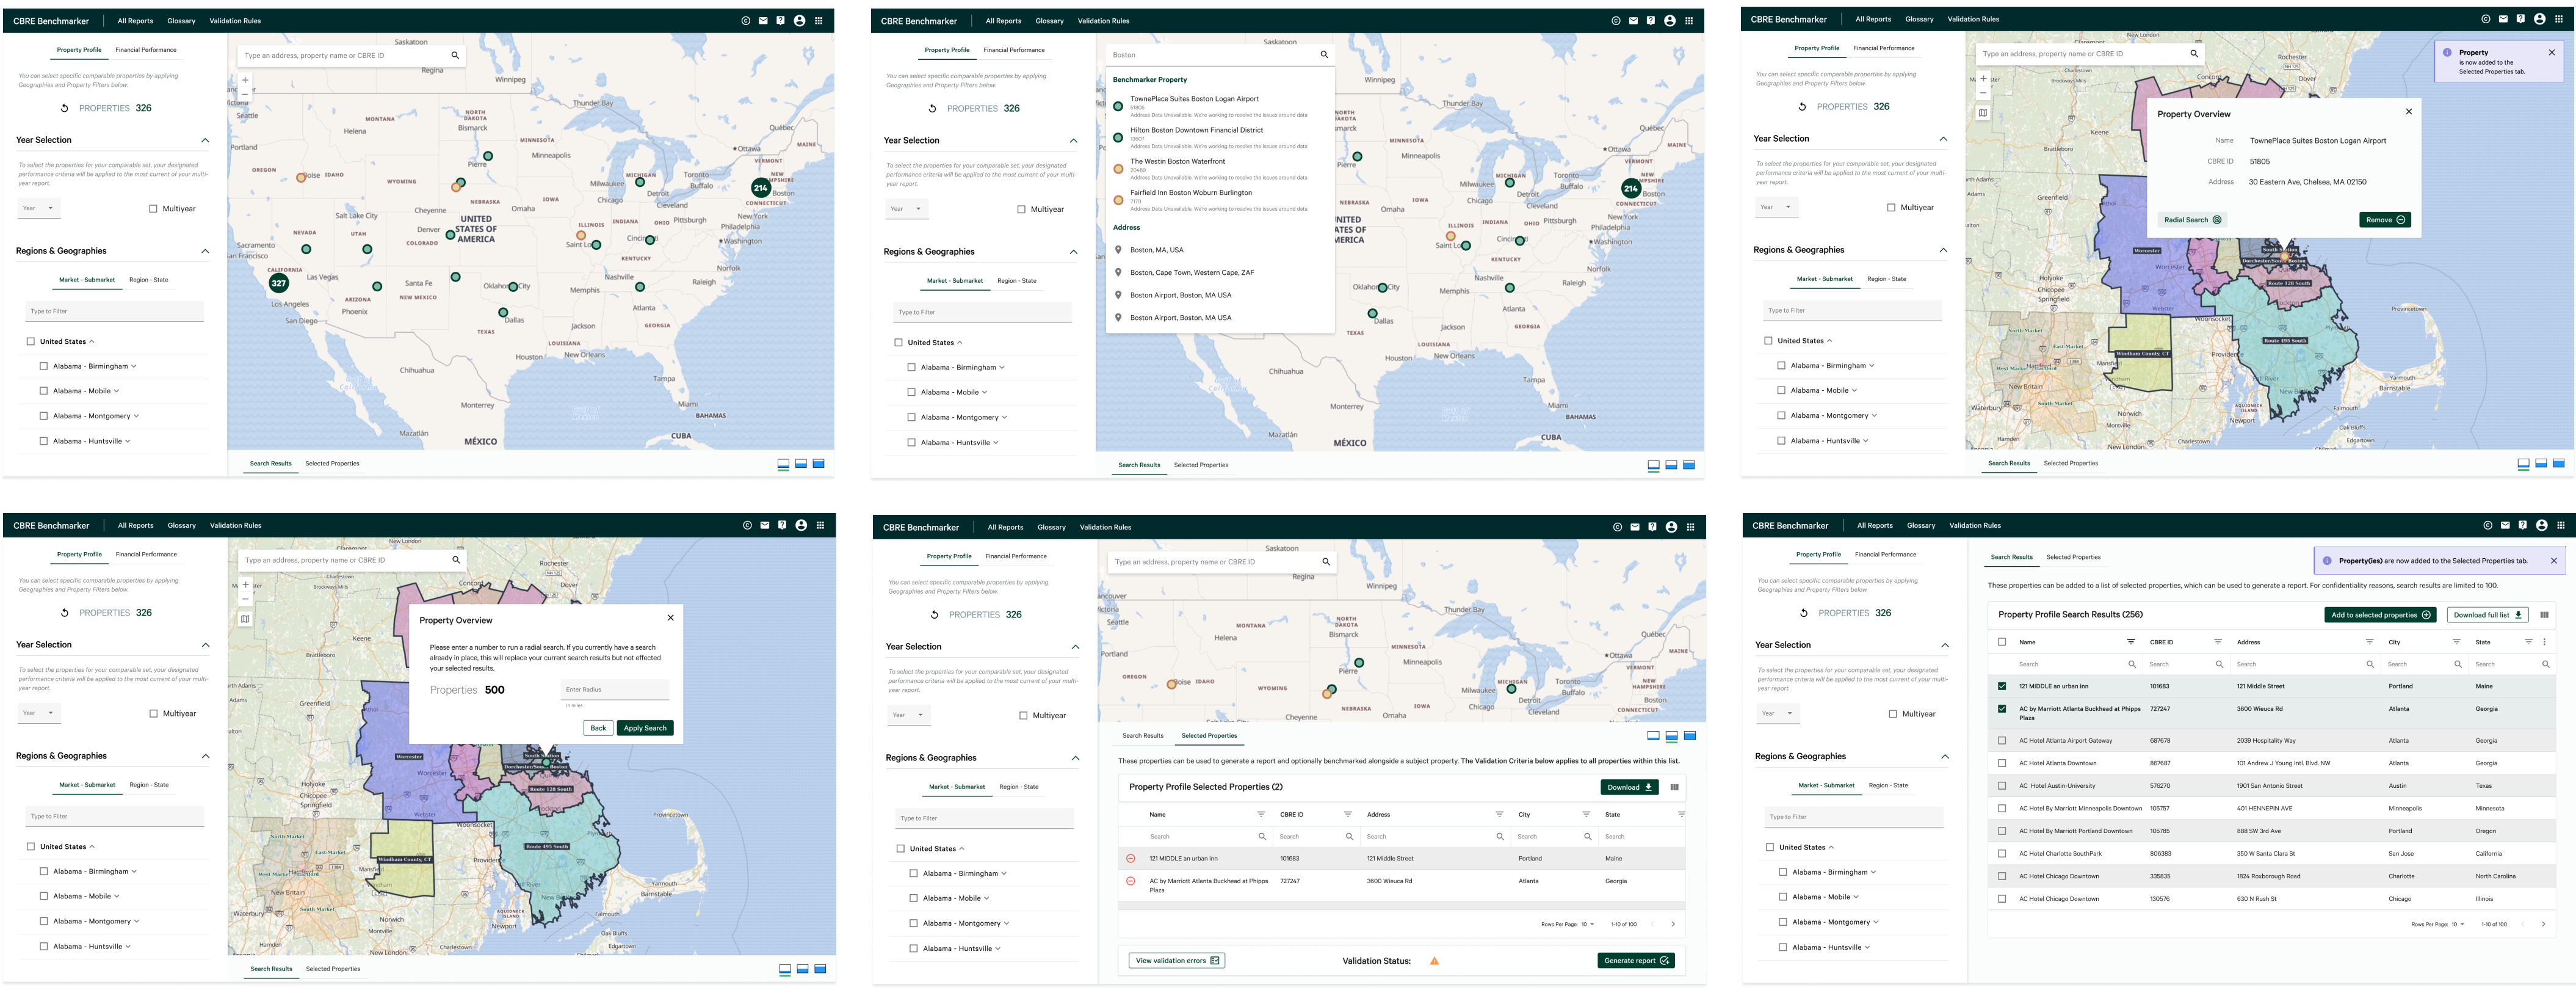
As you select multiple properties, you are able to view all the properties that have been selected or remove certain properties through the "Selected Properties" tab.
After properties are selected, you are able to generate a report based on your selected properties by clicking on the "Generate Report" button.
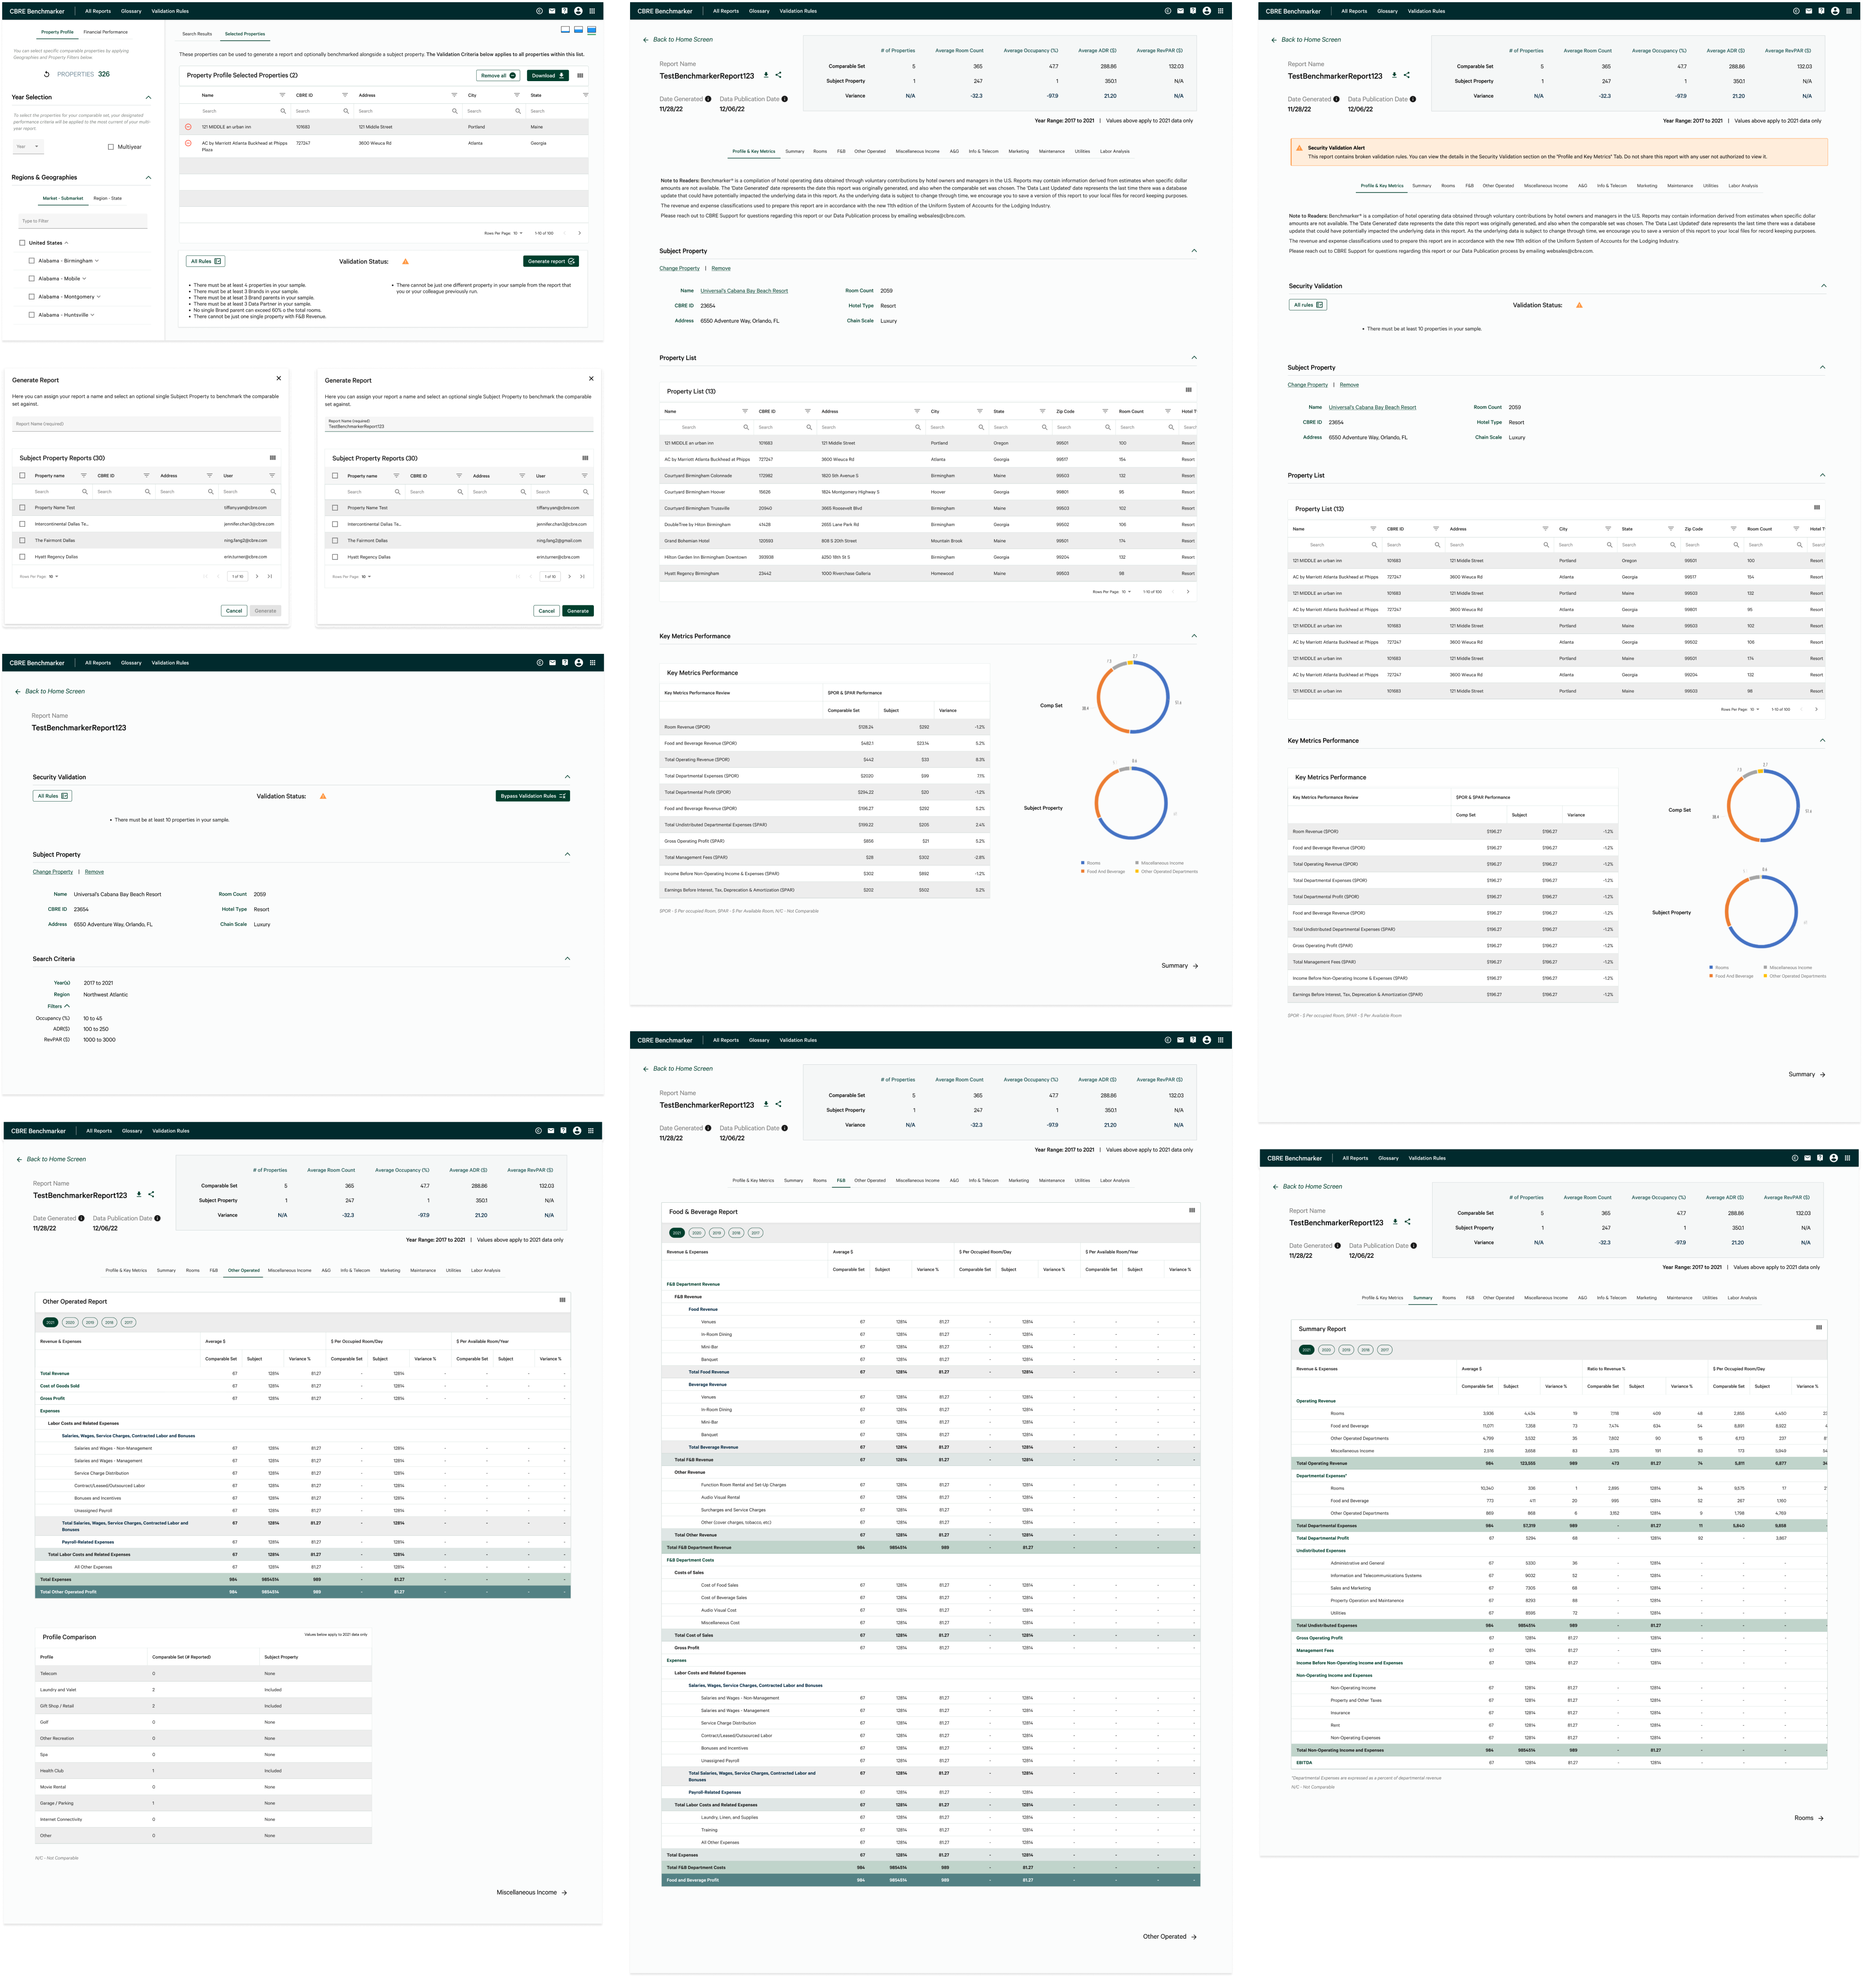
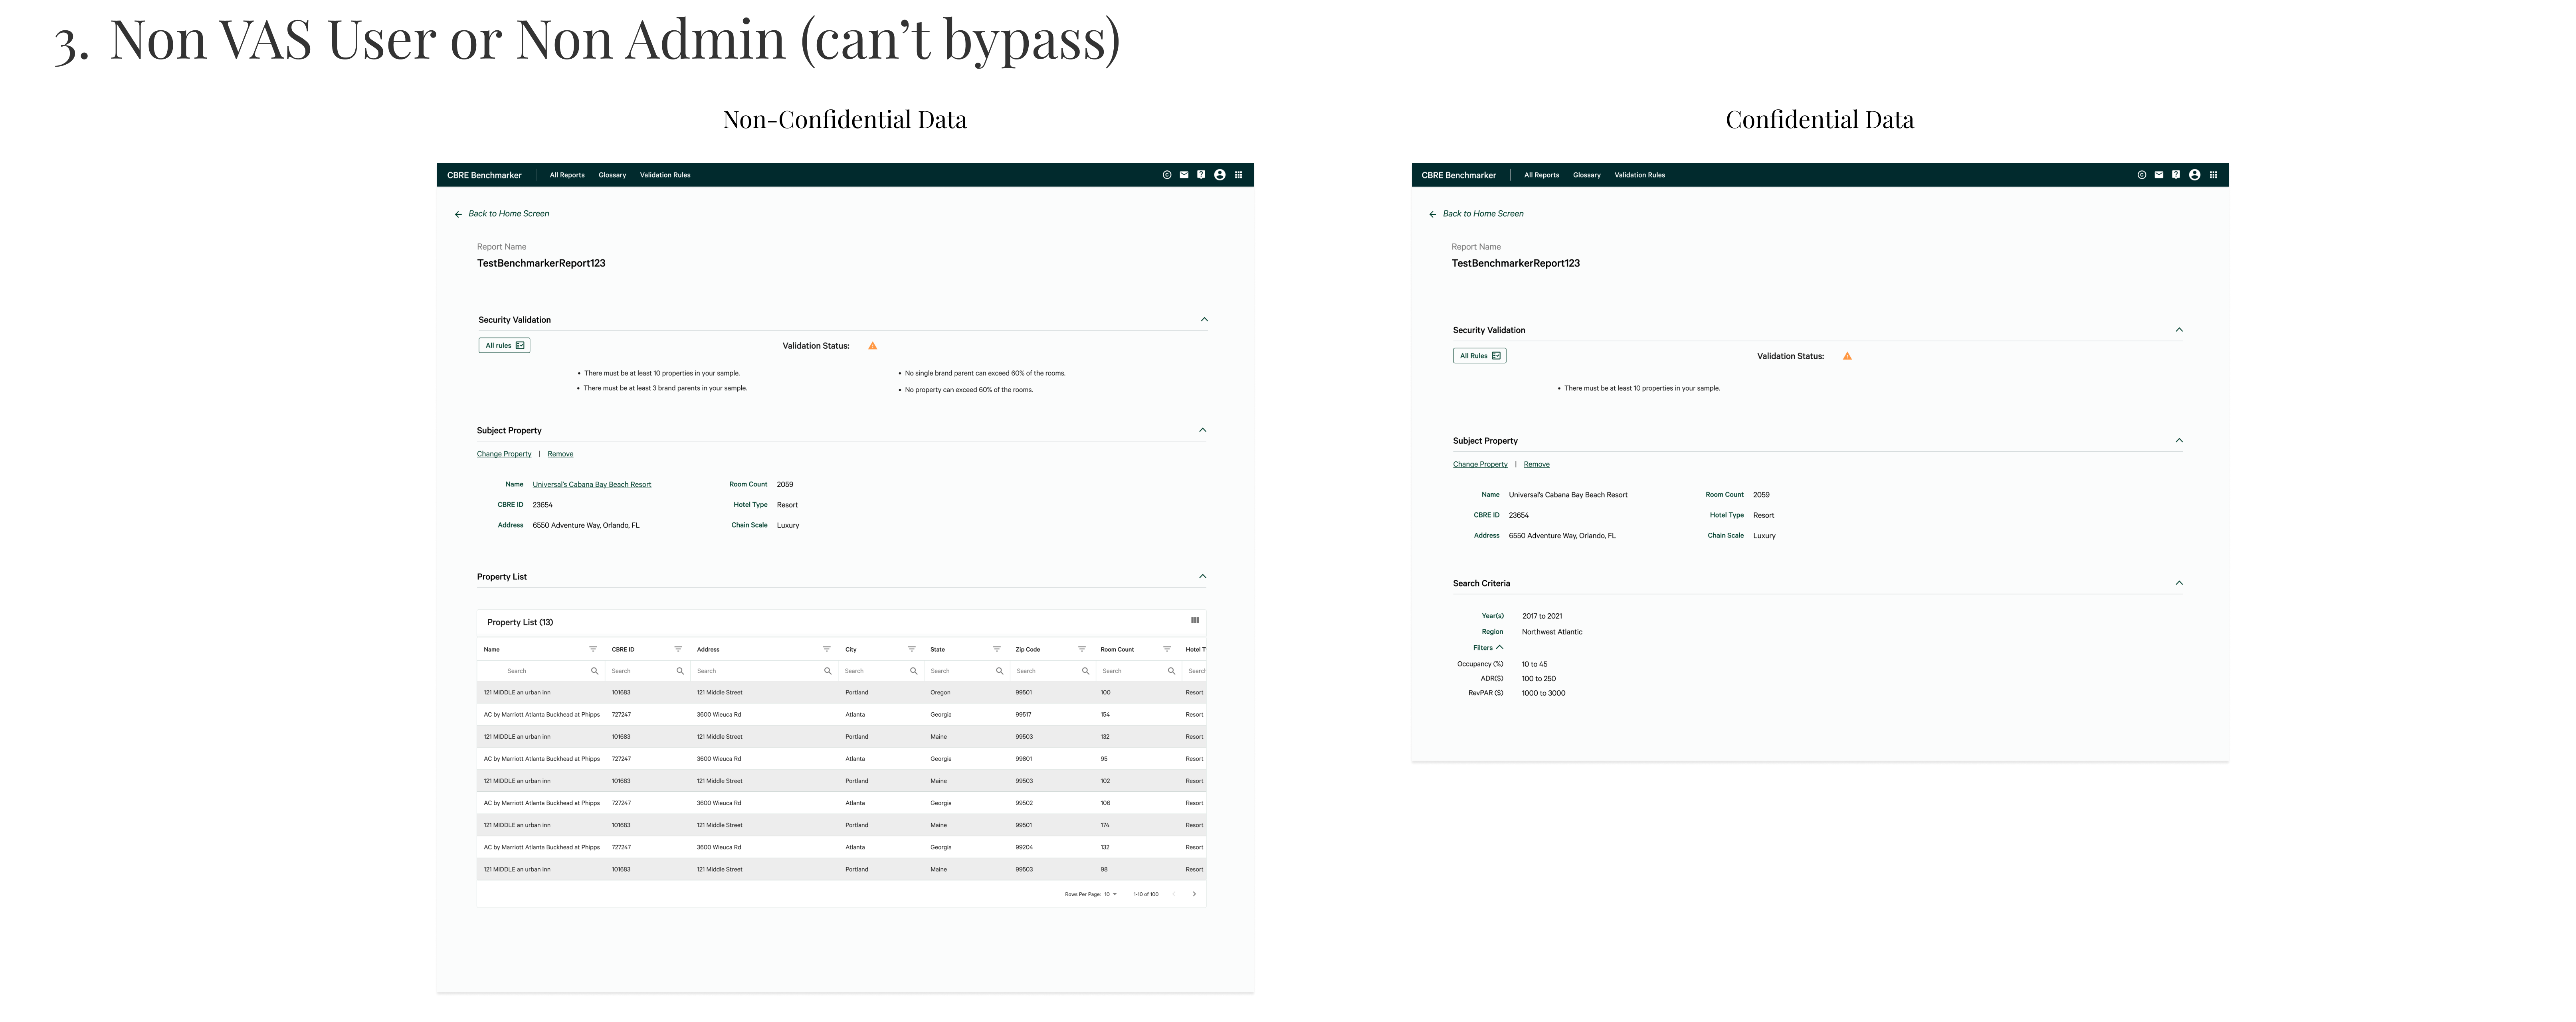
Reports must meet a certain criteria in order to generate reports, and the status can be viewed in the 'Validation Status' box. However, the validation status can be bypassed based on the user subscription type.
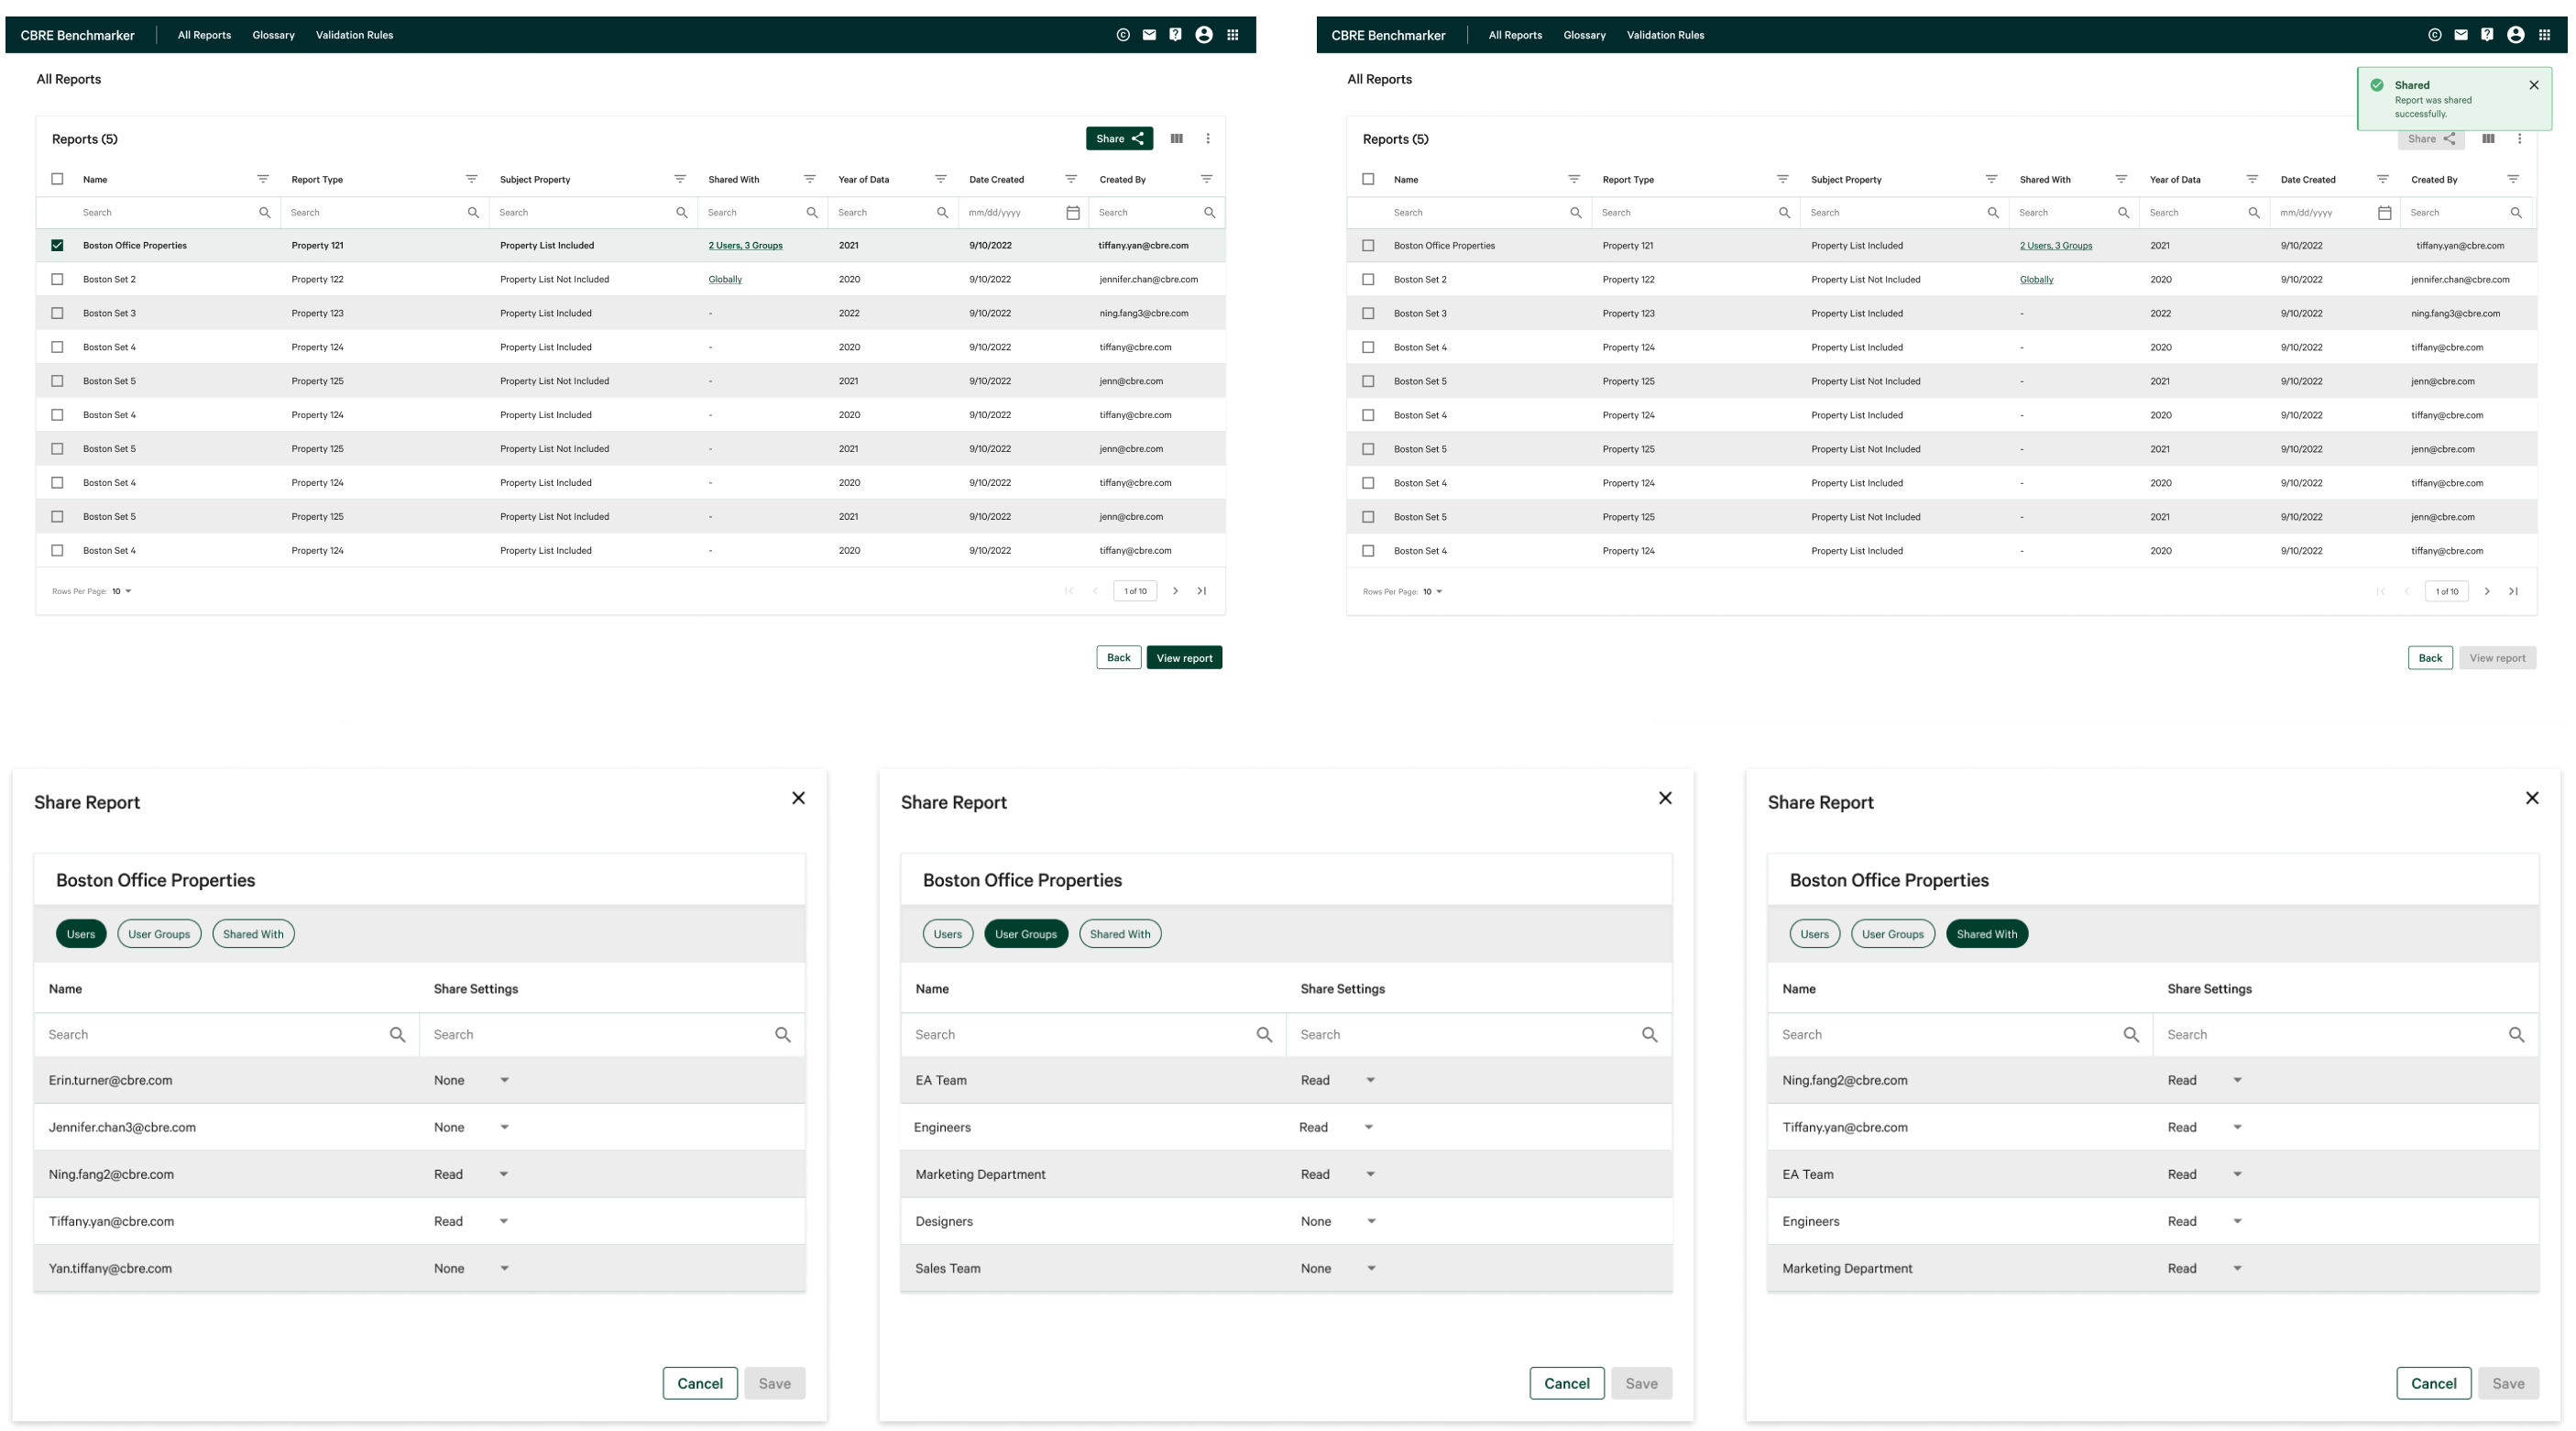
Users are able to see all previously generated reports, and share with specific users or user groups by using the dropdown. For added flexibility, they are also able to go to the "Shared With" tab to view all users or groups the report has been shared with.
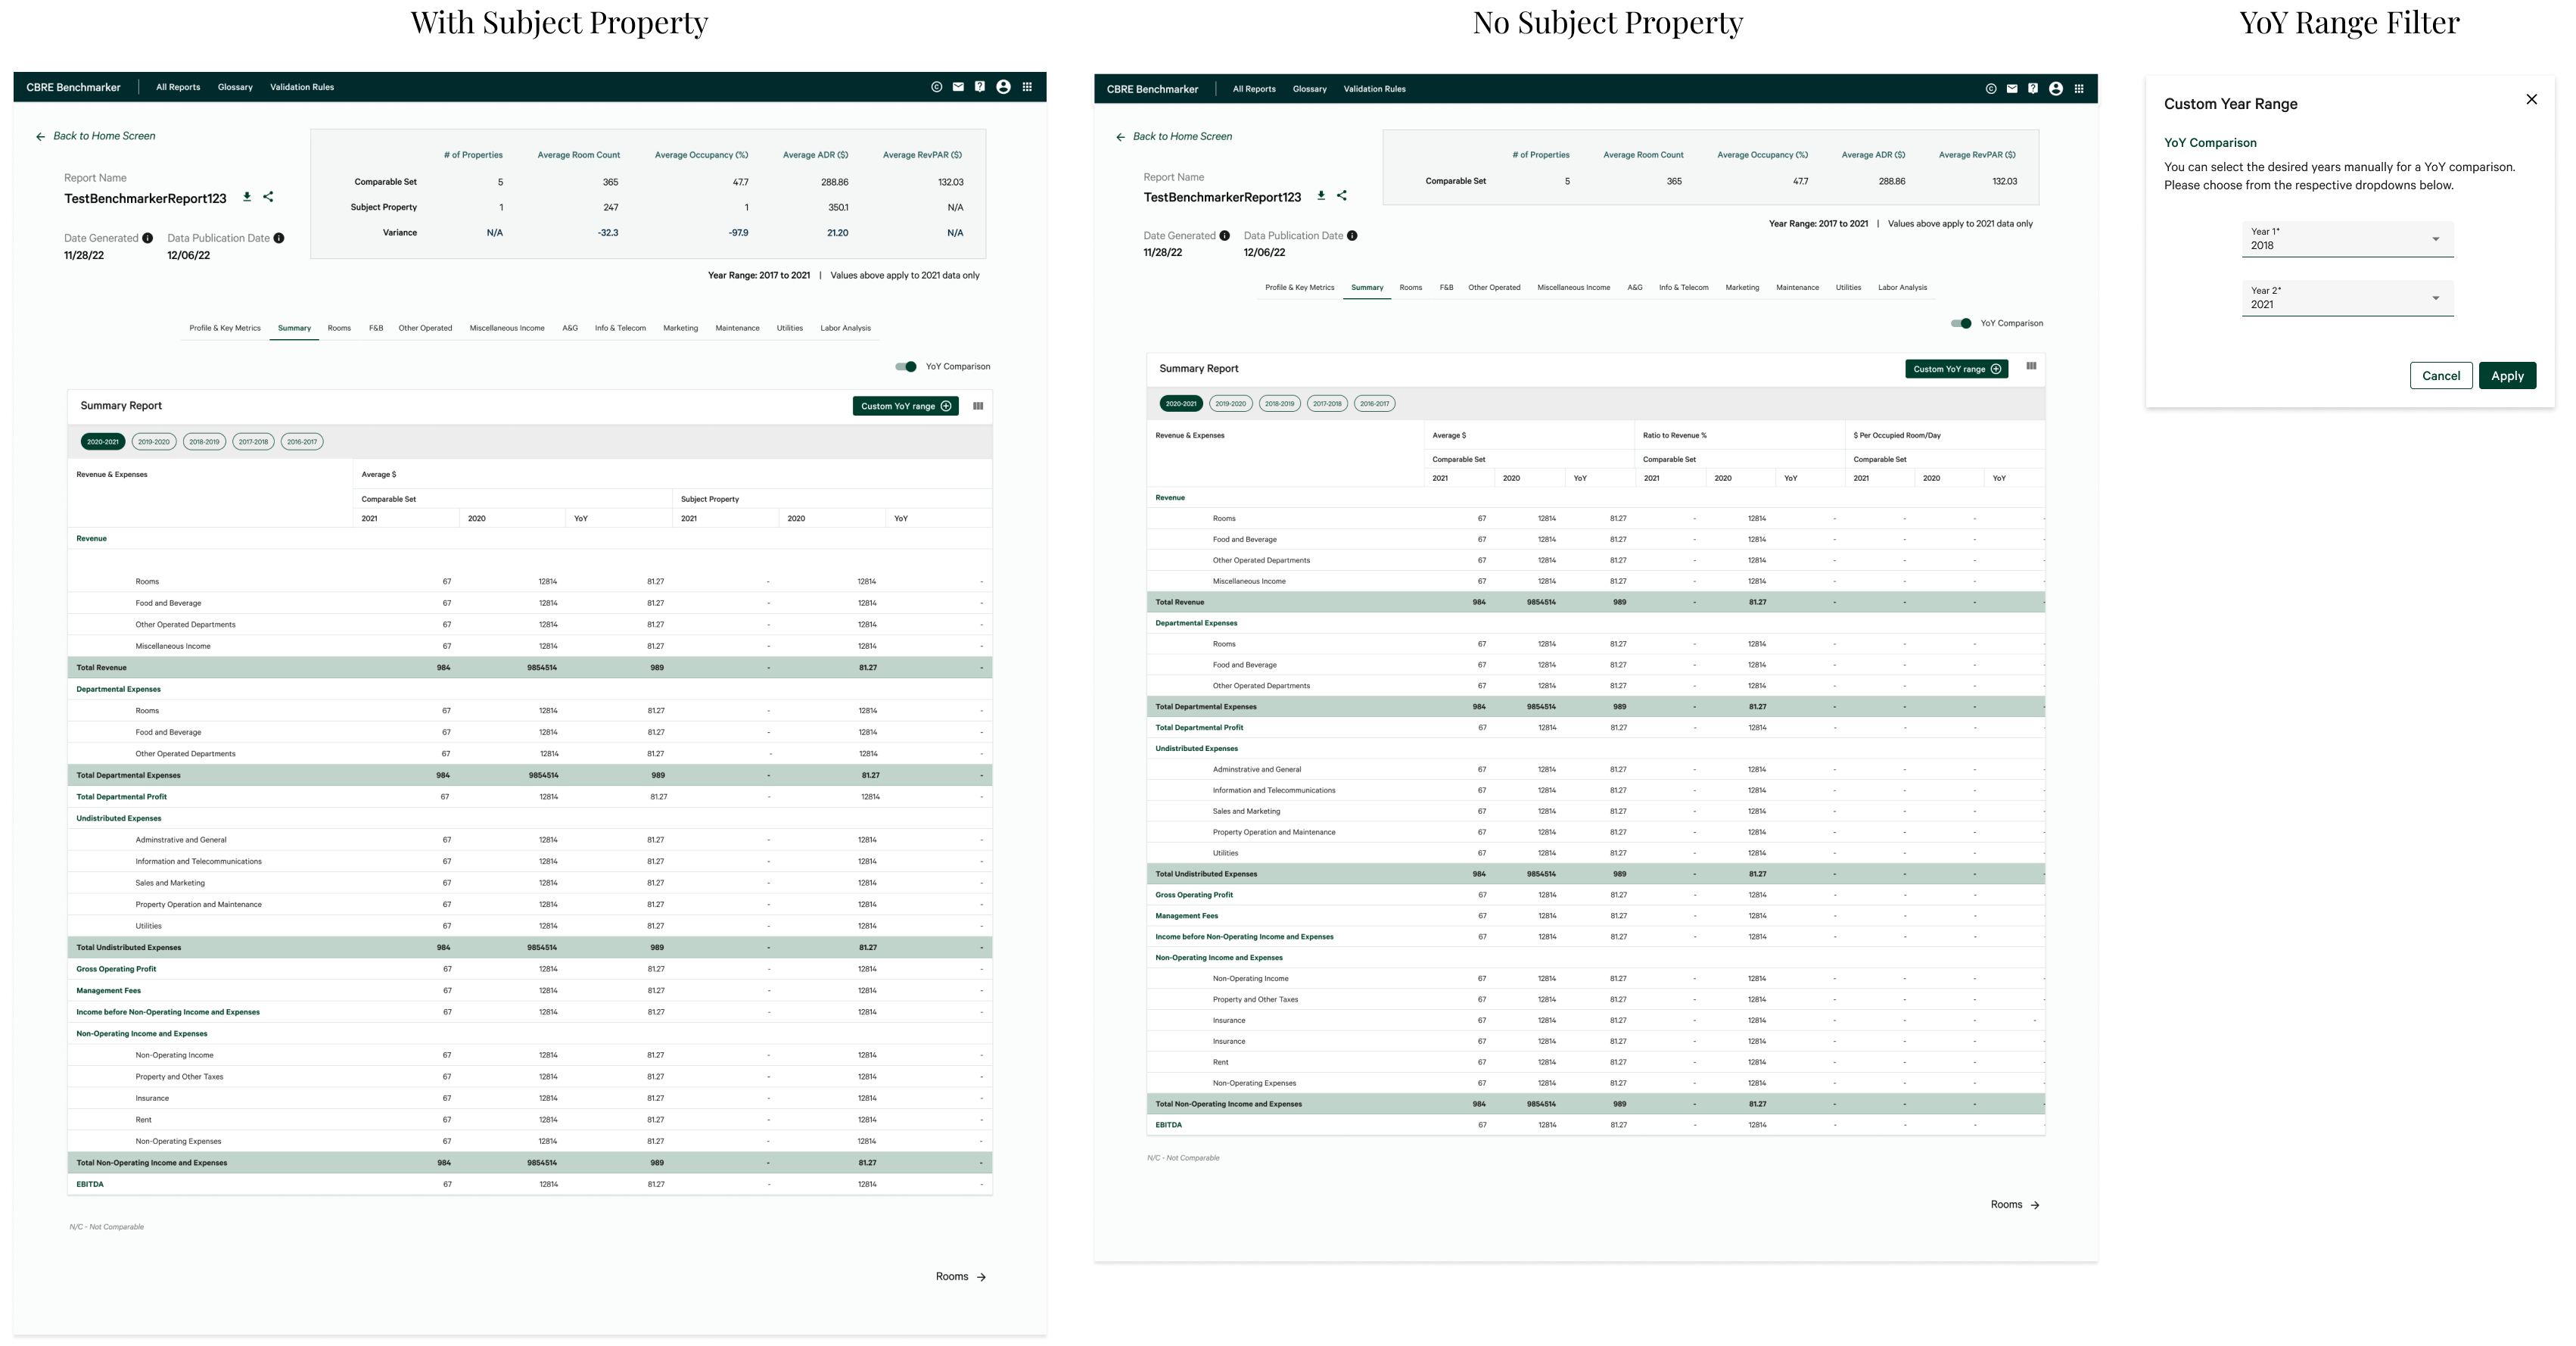
With YoY Comparison, users can view reports on a year to year basis and also add a YoY filter to select a custom range of years for their financial data.
After initial high-fidelity mockups, interviews were conducted to gain empathy for the target group, and to understand user needs and pain points. Responses to the interview were analyzed by our UX Researcher to find common patterns among users.
Interviews were conducted with people that fit the target demographic:
Research found that the left navigation panel was difficult for users to see all of the information displayed in each section because of the length. To integrate this finding from research, the design was updated to have only the first section expanded upon loading, while the other sections were collapsed to only show the title to provide users with more clarity on the sections available to them.
For "All Reports" and "Share Report" feature, the PM raised concerns about the initial modal-on-modal popup design. To solve this issue, I chose to display "All Reports" on a full-sized modal that replicates a new screen. By choosing this route, when users choose to "Share Report", users would be presented with a more seamless experience by only seeing a popup modal upon sharing.

To improve the UX of these features, a feature was added that allows you to see who the report has been shared with already under the 'Shared With' column which improves flexibility and efficiency of use. In addition, using the full-screen "All Reports" modal allows more information to be displayed simultaneously. Upon iterating, I grouped the different user types into separate tabs and removed the checkbox option with pre-set permission settings to reduce confusion and enhance usability as well as consistency within the app.
By changing our designs from a small modal to a full-screen display, we were able to show all available rows of data (including the newly added columns) and allow users to view more reports at once.
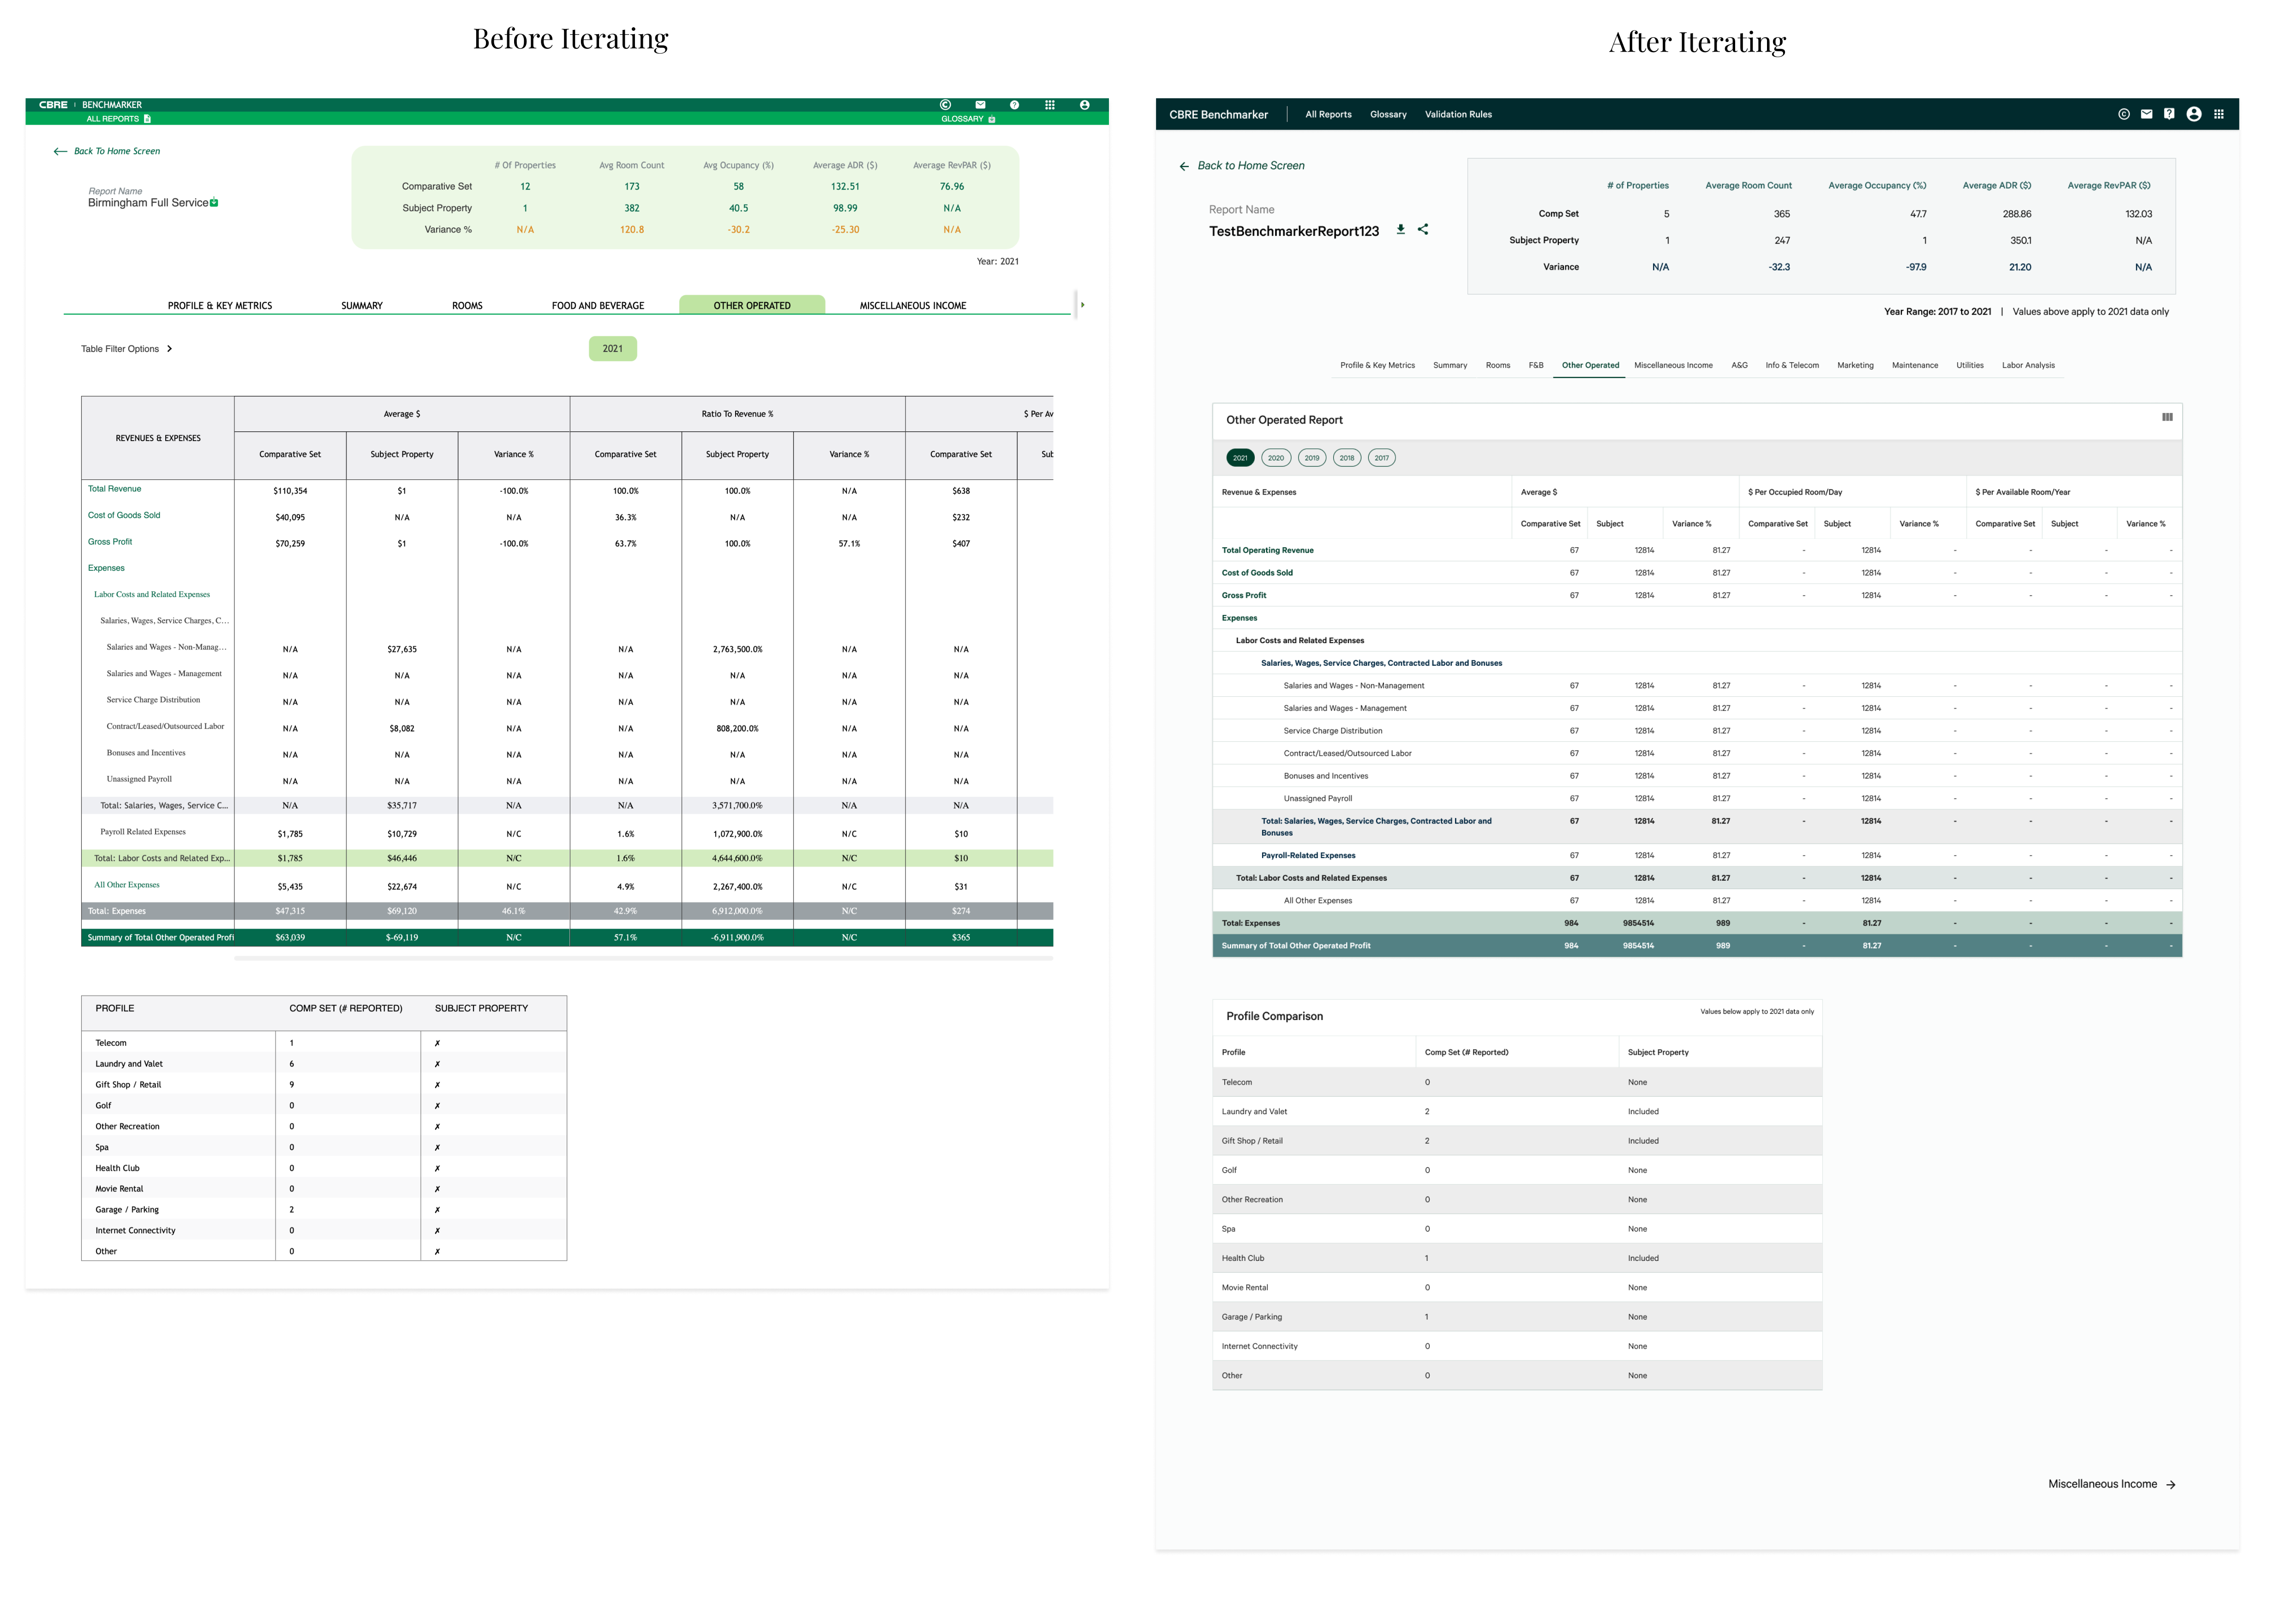
Generated reports were iterated to reflect our new design system, and a new color hierarchy was chosen and implemented by me for each departmental report type. I chose to use gradient coloring to help users easily determine the hierarchy of the table. Year chips previously lived below the departmental tabs as another row of tabs. To iterate and improve the design, the year chips were added into the table to maintain consistency and improve the minimalistic design of the apps.
After my mockups were designed, I would create high fidelity prototypes to demonstrate how the application should function. Mockups and prototypes frequently went through revisions and updates based on feedback from stakeholders and user interviews, especially as we prepared for initial release. In addition to the prototyping for dev handoff, I also prototyped multiple user flows for our user study to guide our product’s next steps.
To view my prototype for the entire Benchmarker app, click on the link below:Benchmarker Prototype
If you like what you see and want to work together, get in touch!
uiuxtiff@gmail.com